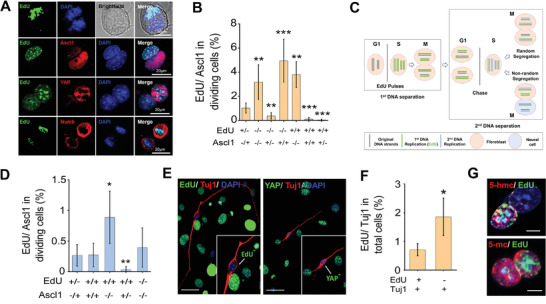
Figure 2.

iN cells inherit newly replicated DNA strands during ACD. A) Immunofluorescent and bright‐field images of asymmetrically dividing fibroblasts stained with EdU, Ascl1, YAP, and Numb after Dox treatment for 24 h. The top panel shows asymmetrically dividing daughter cells at the mitosis stage after initiating iN reprogramming with Dox. Scale bar: 10 µm (top) or 20 µm. B) Quantitative analysis of the presence (+) or absence (−) of EdU‐labeling (based on 3‐h labeling) and Ascl1‐expression in two mitotic cells on day 1. Bar graph shows mean ± SD (n = 6), ** p ≤ 0.01, ***p ≤ 0.001. Significance was determined by a one‐way ANOVA and Tukey's multiple comparison test. C) Pulse‐chase assay to study sister chromatid segregation during cell division. All DNA strands are labeled through the administration of nucleotide analogs (e.g., EdU) over multiple generations when the cells or their precursors are dividing symmetrically. If immortal template strands exist, they would become labeled. Following the label‐free chase period, cells would retain the labeled strands even after multiple cell divisions. However, in an asymmetrically dividing cell, newly synthesized DNA strands are not labeled with EdU during the S phase of the first cell cycle. Inheritance of all the label by only one of the daughter cells in the second cell cycle would indicate that these cells inherited the parental strands. D) Fibroblasts were labeled with EdU for 3 days prior to BAM transduction. One day after initiating iN reprogramming, cells were fixed and stained for EdU and Ascl1. Quantification of the presence (+) or absence (−) of EdU‐labeling and Ascl1 expression in mitotic cells on day 1. Bar graph shows mean ± SD (n = 6), *p ≤ 0.05, **p ≤ 0.01. Significance was determined by a one‐way ANOVA and Tukey's multiple comparison test. E) Pulse‐chasing with EdU was performed as in (B). On day 3, cells were fixed and stained for EdU, Tuj1, and YAP. Scale bar: 50 µm. F) Quantification of the presence (+) or absence (−) of EdU‐labeling in BAM‐transduced fibroblasts expressing Tuj1 on day 3. Bar graph shows mean ± SD (n = 6), *p ≤ 0.05. Significance was determined by a two‐tailed, unpaired t‐test. G) Representative images of asymmetrically dividing fibroblasts stained for 5‐mC, 5‐hmC, and EdU on day 1. Scale bar: 10 µm.
