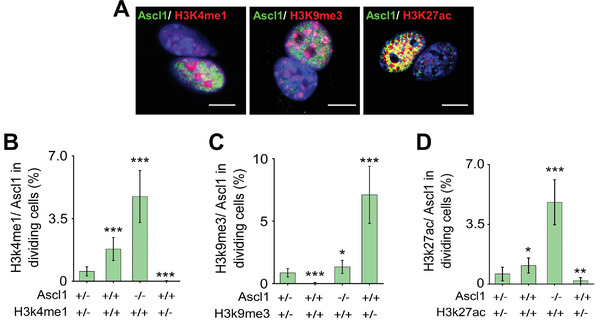
Figure 5.

Asymmetric histone marks during iN conversion. A) Representative images of BAM‐transduced fibroblasts expressing Ascl1 and various histone marks at 24 h after Dox treatment. Scale bar: 10 µm. B–D) Quantitative analysis of the presence (+) or absence (−) of Ascl1 expression and histone marks (H3K4me1, H3K49me3, and H3K27ac) in mitotic cells on day 1. Bar graphs show mean ± SD (n = 6), *p ≤ 0.05, **p ≤ 0.01, ***p ≤ 0.001, and significance was determined by a one‐way ANOVA and Tukey's multiple comparison test.
