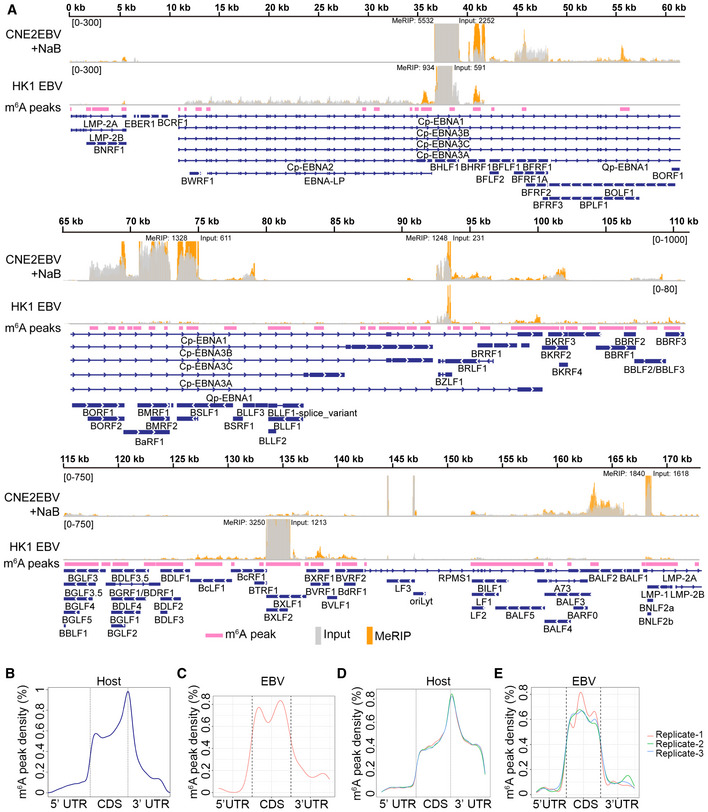
Figure 1. EBV transcripts are m6A modified.

-
AMap showing the EBV epitranscriptome in CNE2EBV with induced EBV reactivation, or HK1 cells with acute EBV infection. CNE2EBV cells were treated with NaB (2 mM) for 24 h to reactivate EBV. For acute EBV infection, RNA of HK1 cells was harvested at 24 hpi. The m6A peaks, identified based on all MeRIP‐seq data using MACS2, are indicated as pink bars. The input and MeRIP coverage are indicated with gray and orange bars, respectively. The coverage is shown as a number if out of range.
-
B, CDistribution of the m6A peaks across host mRNAs (B) and EBV mRNAs (C) was analyzed based on the MeRIP‐seq data.
-
D, EDistribution of the m6A peaks across the host transcripts (D) and EBV transcripts (E) was analyzed based on three independent PA‐m6A‐seq experiments. PA‐m6A‐seq assays were performed in CNE2EBV cells following EBV reactivation, which was induced using TPA and NaB.
