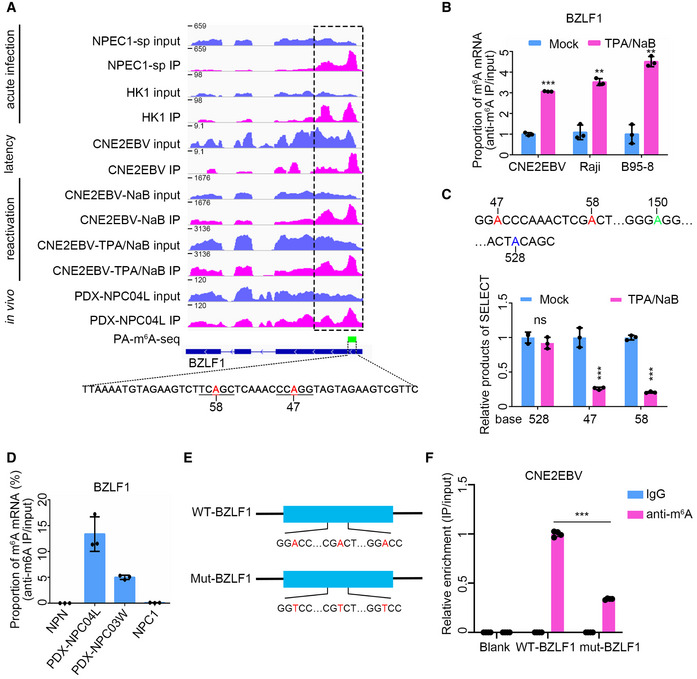
m6A peak distribution of BZLF1 in different EBV infection stages was analyzed based on MeRIP‐seq data. The data presented from the top down are the EBV acute infected (24 hpi) NPEC1‐Bmi1 sphere‐like cells (NPEC‐sp), and HK1 cells; latently infected CNE2EBV cells; and CNE2EBV cells with reactivated EBV induced using NaB alone or TPA/NaB together. For acute EBV infection, RNA was harvested at 24 hpi. TPA (30 ng/ml) and NaB (2 mM) were used alone or together to treat the cells for 24 h to reactivate EBV. The PA‐m6A‐seq peak is indicated by the green box, and the potential m6A sites on the indicated sequence are shown in red. The region indicated by the dotted box was PCR‐amplified to construct the wild‐type BZLF11‐262nt plasmid.
The BZLF1 m6A levels were measured using MeRIP‐qPCR in CNE2EBV, Raji, and B95‐8 cells with latent EBV infection or lytic reactivation. TPA (30 ng/ml) and NaB (2 mM) were used to treat the cells for 24 h to reactivate EBV. The cellular RNA was harvested for MeRIP‐qPCR assays. The fold enrichment was determined by calculating the 2−Δ
C
t of the MeRIP sample relative to the input sample. The mean value of the results in mock‐treated cells was normalized to 1. Experiments were independently repeated three times, and the results are represented as the means ± SD of n = 3 biological replicates. **P < 0.01 and ***P < 0.001 compared to mock‐treated cells according to unpaired Student’s t‐test.
The relative product abundance of SELECT at the predicted m6A sites in the latently infected or lytic reactivated CNE2EBV cells. TPA (30 ng/ml) and NaB (2 mM) were used to treat the CNE2EBV cells for 24 h to reactivate EBV. The mean value of results in mock‐treated cells was normalized to 1. Experiments were independently repeated three times, and the results are represented as the means ± SD of n = 3 biological replicates. ***P < 0.001 compared to the mock‐treated group according to unpaired Student’s t‐test.
The validation of the BZLF1 m6A peaks by MeRIP‐qPCR in PDXs, NPC1, and NPN. One nontumor control biopsy (NPN), one NPC sample (NPC1), and two PDX samples (PDX‐NPC04L and PDX‐NPC03W) were used to perform the MeRIP‐qPCR assays. The fold enrichment was determined by calculating the 2−Δ
C
t of the MeRIP sample relative to the input sample. The data represent the means ± SD of n = 3 technical replicates.
Construction of the WT‐BZLF1 and mut‐BZLF1 plasmids. The WT‐BZLF1 plasmid was constructed by inserting the BZLF11–262nt fragment (1–262 nt of the BZLF1 mRNA) into pcDNA3.1+ plasmid. The mut‐BZLF1 plasmid was constructed by introducing A>T mutations at the putative m6A sites of BZLF11–262nt.
The IgG or anti‐m6A antibody enrichment of the WT‐BZLF1 and mut‐BZLF1 mRNAs was measured by RIP‐qPCR in the CNE2EBV cell lines. Blank indicates CNE2EBV cells without plasmids transfection. The fold enrichment was determined by calculating the 2−Δ
C
t of the RIP sample relative to the input sample. The mean value of the m6A enrichment level on WT‐BZLF1 mRNA was normalized to 1. Experiments were independently repeated four times, and the results are represented as the means ± SD of n = 4 biological replicates. ***P < 0.001 according to unpaired Student’s t‐test.

