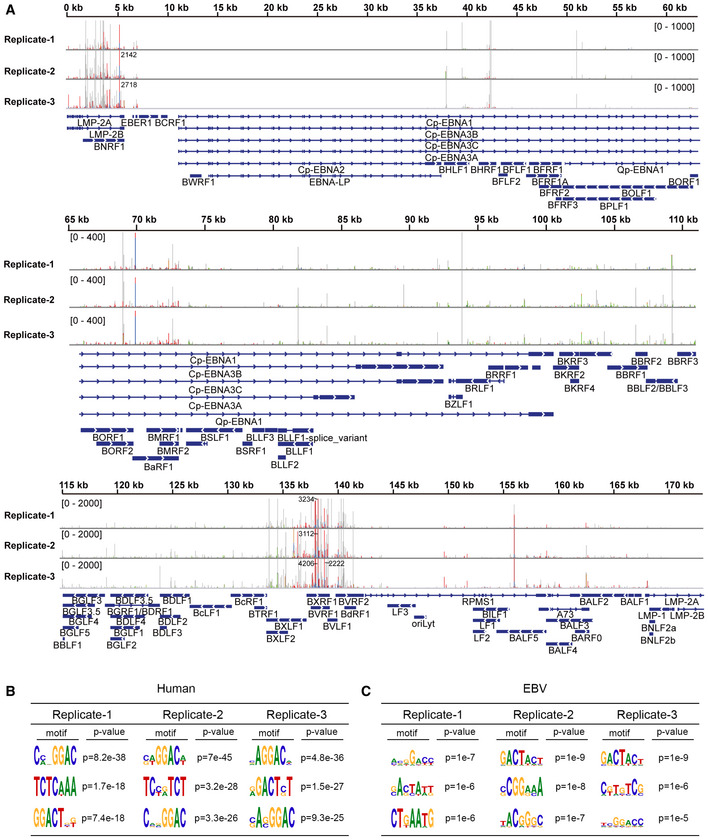
Figure EV2. Analysis of the EBV m6A epitranscriptome based on PA‐m6A‐seq data of CNE2EBV cells following EBV reactivation.

-
ASites of m6A modification in EBV transcripts were mapped by analyzing the PA‐m6A‐seq data from CNE2EBV cells following EBV reactivation. Three independent PA‐m6A‐seq experimental replicates are shown. CNE2EBV cells were induced with TPA (30 ng/ml) and NaB (2 mM) for 4 h to reactivate EBV and were then pulsed with 200 µM 4SU for 20 h. The 4SU‐based CLIP technique results in T‐to‐C mutations at cross‐linked 4SU residues that arise during reverse transcription. Red/blue bars indicate sites of T‐to‐C conversions. Green/brown bars indicate sites of A‐to‐G conversions. The coverage is shown as a number if out of range.
-
B, CMotif analysis to identify consensus sequences on host transcripts (B) and EBV transcripts (C) based on three independent PA‐m6A‐seq experiments. The top three motifs for each are shown.
