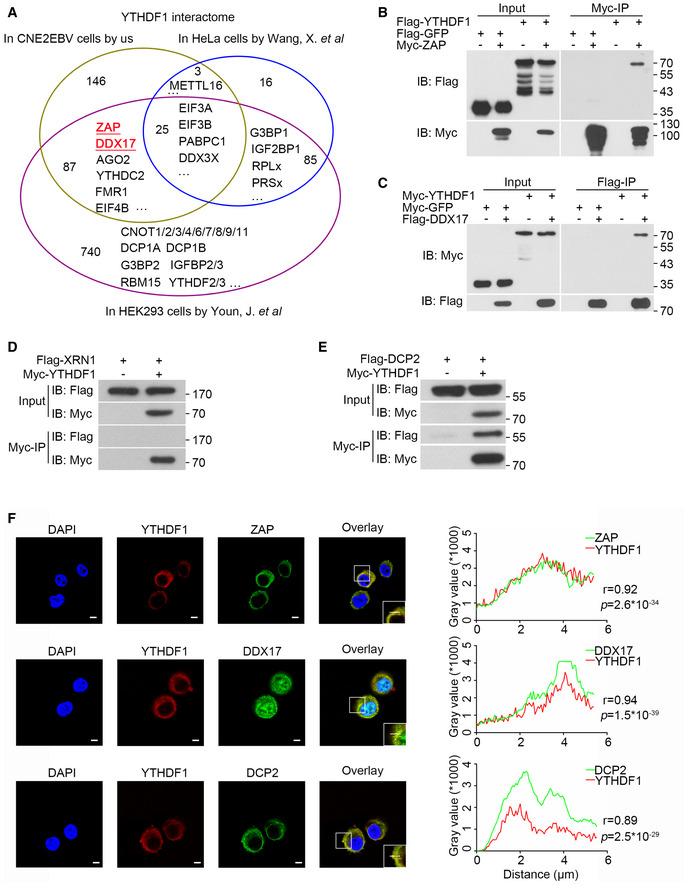
Figure EV4. YTHDF1 interacts with ZAP, DDX17, and DCP2.

-
AVenn diagram of YTHDF1 interaction partners in CNE2EBV, HeLa, and HEK293 cells.
-
B, CThe interactions between YTHDF1 and ZAP (B) or DDX17 (C) were detected by co‐IP assays in 293T cells. The results were detected using the indicated antibodies.
-
DYTHDF1 did not interact with XRN1 according to the co‐IP assay in 293T cells.
-
EThe interaction of YTHDF1 with DCP2 detected by co‐IP assays in 293T cells.
-
FCo‐localization of the endogenous YTHDF1 with ZAP, DDX17, and DCP2 in HK1 cells detected by immunofluorescence. YTHDF1 was stained with the mouse monoclonal YTHDF1 antibody and an Alexa Fluor 594‐conjugated secondary antibody. ZAP, DDX17, and DCP2 were stained with the target‐specific rabbit primary antibodies and an Alexa Fluor 488‐conjugated secondary antibody. The nuclei were counterstained with DAPI (blue). The merged signal of YTHDF1 and ZAP, DDX17, or DCP2 is shown in yellow. Representative of three independent experiments are shown. Scale bars: 5 μm. The right panel shows the results of co‐localization analysis in the selected region analyzed under a confocal laser scanning microscope. r: correlation coefficients. The P‐values were calculated using Pearson’s correlation test.
Source data are available online for this figure.
