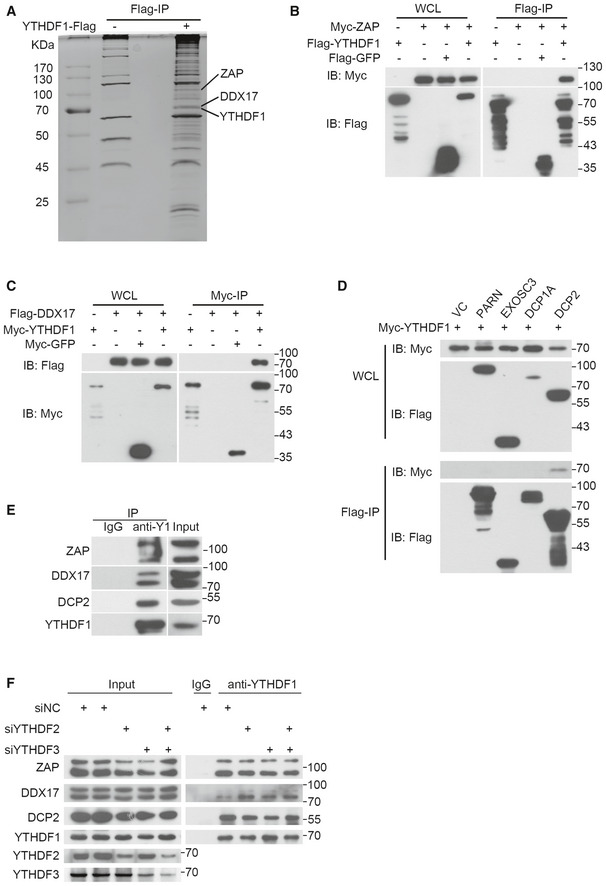
Figure 6. YTHDF1 interacts with the RNA degradation complex.

-
AThe interaction partners of YTHDF1 were identified by pull‐down assays and mass spectrometry. The Flag‐YTHDF1 pull‐down assay was performed in CNE2EBV cells transfected with a plasmid encoding Flag‐tagged YTHDF1. The proteins in the differentially abundant bands were identified by mass spectrometry.
-
B, CThe interactions between YTHDF1 and ZAP (B) or DDX17 (C) were measured by co‐IP in 293T cells. The results were detected using specific antibodies.
-
DThe interaction between YTHDF1 and DCP2 was detected by co‐IP in 293T cells.
-
EThe interactions between endogenous YTHDF1 and ZAP, DDX17, or DCP2 were detected by endogenous IP using a YTHDF1‐specific antibody in CNE2EBV cells.
-
FThe interactions between endogenous YTHDF1 and ZAP, DDX17, or DCP2 were detected by endogenous IP assays in CNE2EBV cells transfected with YTHDF2‐, YTHDF3‐specific siRNAs or the siNC control. YTHDF1, YTHDF2, YTHDF3, ZAP, DDX17, and DCP2 were detected in the immunoprecipitated complexes using specific antibodies, respectively.
Source data are available online for this figure.
