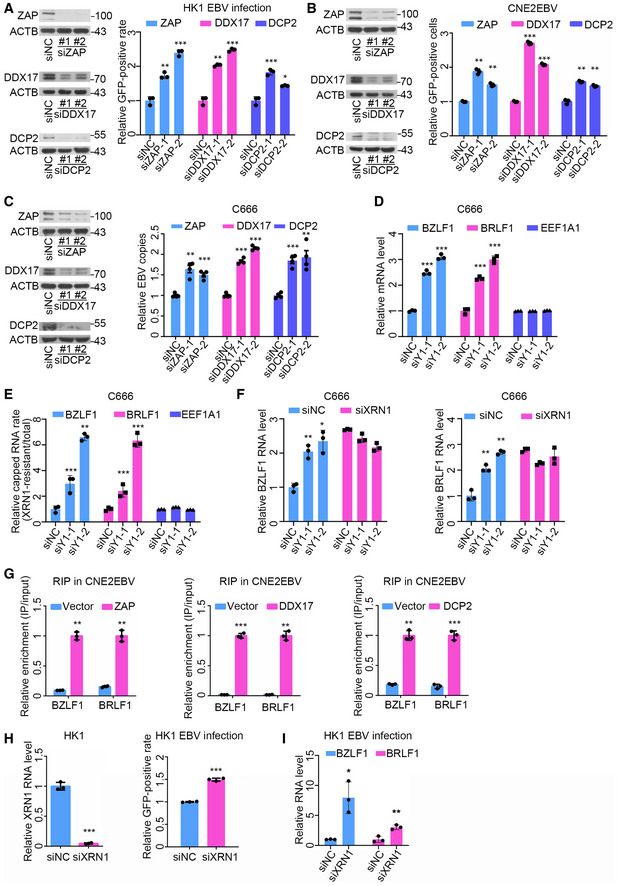
Figure 7. YTHDF1 promotes viral mRNA decapping by recruiting the RNA degradation complex.

- The ratios of GFP‐positive HK1 cells transfected with the ZAP‐, DDX17‐, and DCP2‐specific siRNAs or the siNC control were quantified using FACS. At 24 h post‐siRNA transfection, the protein level of indicated genes was determined by Western blot analysis. ACTB was used as loading control. The experiments were performed similarly as described in Fig 3B, except the different siRNA transfection. Experiments were independently repeated three times, and the results are represented as the means ± SD of n = 3 biological replicates. *P < 0.05, **P < 0.01, and ***P < 0.001 compared to siNC according to unpaired Student’s t‐test.
- The GFP‐positive cells in CNE2EBV cells transfected with the ZAP‐, DDX17‐, and DCP2‐specific siRNAs or the control siRNA following EBV reactivation were quantified using FACS. At 24 h post‐siRNA transfection, the protein level of indicated genes was determined by Western blot analysis. ACTB was used as loading control. The experiments were performed similarly as described in Fig 3D, except the different siRNA transfection. Experiments were independently repeated three times, and the results are represented as the means ± SD of n = 3 biological replicates. **P < 0.01 and ***P < 0.001 compared to siNC according to unpaired Student’s t‐test.
- The relative number of EBV copies in C666 cells transfected with the ZAP‐, DDX17‐, and DCP2‐specific siRNAs or the siNC control was measured using qPCR. At 24 h post‐siRNA transfection, the protein level of indicated genes was determined by Western blot analysis. ACTB was used as loading control. The experiments were performed similarly as described in Fig 3K, except the different siRNA transfection. Experiments were independently repeated four times, and the results are represented as the means ± SD of n = 4 biological replicates. **P < 0.01 and ***P < 0.001 compared to siNC according to unpaired Student’s t‐test.
- The relative mRNA levels of BZLF1 and BRLF1 in C666 cells transfected with the YTHDF1‐specific siRNAs (siY1‐1 and siY1‐2) or the siNC control. The experiments were performed similarly as described in Fig 4C. Experiments were independently repeated three times, and the results are represented as the means ± SD of n = 3 biological replicates. *P < 0.05, **P < 0.01, and ***P < 0.001 compared to siNC according to unpaired Student’s t‐test.
- The ratio of endogenous 5′‐capped BZLF1 and BRLF1 mRNAs in C666 cells at 24 h post‐transfection with the YTHDF1‐specific siRNAs or the siNC control. The ratios of endogenous 5′‐capped mRNAs were quantified by dividing the abundance of XRN1‐resistant transcripts with the total amount of transcripts. Experiments were independently repeated three times, and the results are represented as the means ± SD of n = 3 biological replicates. **P < 0.01 and ***P < 0.001 compared to siNC according to unpaired Student’s t‐test.
- The relative mRNA levels of BZLF1 and BRLF1 in C666 cells transfected with YTHDF1‐specific siRNAs and XRN1‐specific siRNAs. The C666 cells were co‐transfected with YTHDF1‐specific siRNAs and XRN1‐specific siRNAs for 24 h. The mRNA levels were determined using qPCR. Experiments were independently repeated three times, and the results are represented as the means ± SD of n = 3 biological replicates. *P < 0.05 and **P < 0.01 compared to siNC according to unpaired Student’s t‐test.
- The relative enrichment of BZLF1 and BRLF1 mRNAs by ZAP, DDX17, or DCP2 in CNE2EBV cells following EBV reactivation. CNE2EBV cells were transfected with plasmids encoding myc‐ZAP, myc‐DDX17, myc‐DCP2, or vector control. At 24 h post‐transfection, the cells were treated with TPA (30 ng/ml) and NaB (2 mM) for 24 h. The RIP assays were performed using Myc‐beads. The fold enrichment was determined by calculating the 2−Δ C t of the RIP sample relative to the input sample. Experiments were independently repeated three times, and the results are represented as the means ± SD of n = 3 biological replicates. **P < 0.01 and ***P < 0.001 compared to Vector according to unpaired Student’s t‐test.
- Determination of the EBV infection efficiency in HK1 cells transfected with the XRN1‐specific siRNA or the siNC control. After 24 h of siRNA transfection, HK1 cells were infected with EBV and analyzed by FACS at 24 hpi. Experiments were independently repeated three times, and the results are represented as the means ± SD of n = 3 biological replicates. ***P < 0.001 compared to siNC according to unpaired Student’s t‐test.
- The relative mRNA levels of BZLF1 and BRLF1 in the EBV‐infected HK1 cells transfected with the XRN1‐specific siRNA (siXRN1) or the siNC control at 24 hpi. All gene expression levels were normalized to the housekeeping gene ACTB. Experiments were independently repeated three times, and the results are represented as the means ± SD of n = 3 biological replicates. *P < 0.05 and **P < 0.01 compared to siNC according to unpaired Student’s t‐test.
Source data are available online for this figure.
