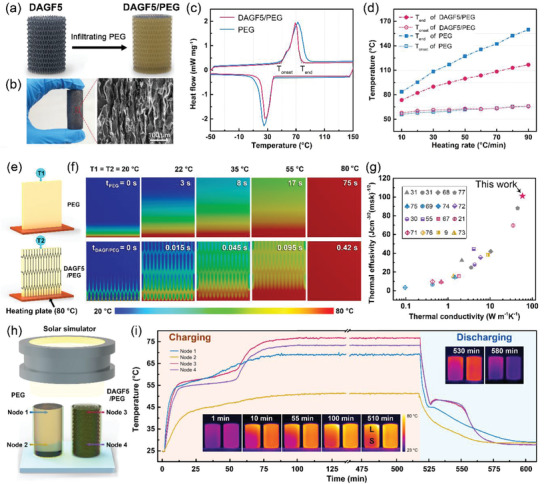
Figure 6.

a) Schematic illustrating the fabrication process of the DAGF5/PEG with the corresponding photograph and cross‐sectional SEM image showing in (b). c) DSC heating and cooling scan curves for pure PEG and DAGF5/PEG with a heating rate of 10 °C min−1. d) The T onset and T end of PEG and DAGF5/PEG versus the DSC heating rate. e) Schematic of the ANSYS simulation models and f) the calculated transient temperature distribution for PEG and DAGF5/PEG. The temperature of the heating plate is maintained at 80 °C. g) A comparison of the thermal conductivity and the thermal effusivity of our DAGF5/PEG and with the reported carbon‐based phase‐change composites. h) Schematic illustrating the solar‐thermal energy conversion measurement. i) Temperature evolution curves for PEG and DAGF5/PEG under stimulant solar irradiation. The insets show the infrared images of the two samples during the charging and discharging process.
