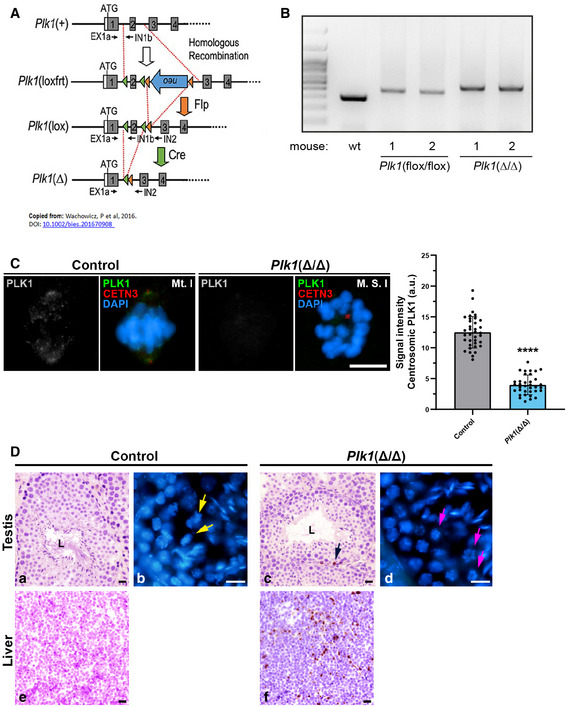
Figure EV3. Gene strategy and PCR analysis for Plk1(Δ/Δ) mouse model.

- Schematic representation of the conditional alleles (loxfrt or lox) and the null allele (–) obtained upon Cre‐mediated recombination for Plk1, extracted from Wachowicz et al 2016.
- Example of genomic genotyping PCRs for Plk1 alleles (lox and Δ alleles) obtained from testis of the indicated mice.
- Immunolabelling of PLK1 (grey/green), CETN3 (red) and chromatin counterstained using DAPI (blue) in metaphases I from control ‐Plk1(+/+)‐ and Plk1(Δ/Δ) mice. Scale bar represents 10 μm. Experiments were conducted for two biological replicates. Number of cells analysed: control (n = 36), Plk1(Δ/Δ) (n = 35). Data are mean ± SD; ****P < 0.0001, Student’s t‐test.
- Histological section of seminiferous tubules stained with H/E staining in control (a) and Plk1(Δ/Δ) (c). [“L” indicates the lumen of the seminiferous tubule; black arrow indicates the position of an apoptotic cell]. Histological section of liver stained with H/E staining in control (e) and Plk1(Δ/Δ) (f). Cryosection of testis and counterstaining with DAPI in control (b) and Plk1(Δ/Δ) (d). Yellow arrows indicate the presence of aligned metaphases (a). Pink arrows indicate the presence of apparently monopolar metaphases (d). Scale bars represent 20 μm.
Source data are available online for this figure.
