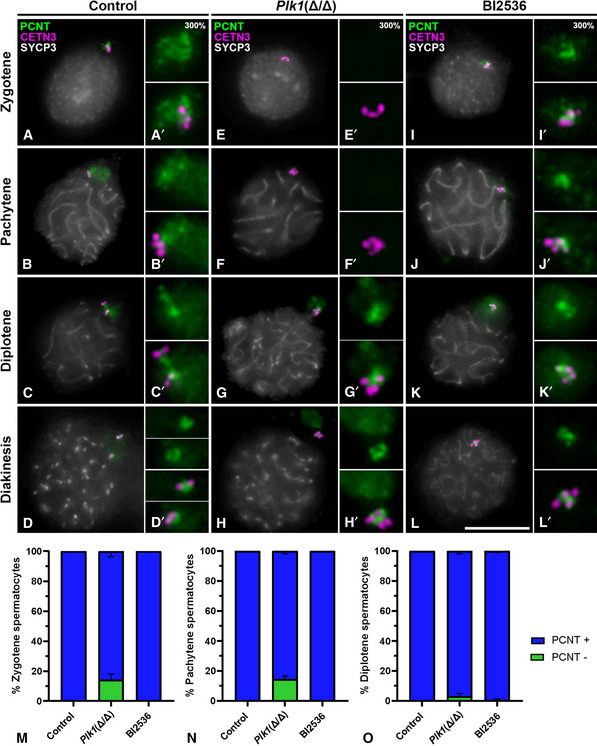
Figure 5. Triple immunolabelling of PCNT, CETN3 and SYCP3 during prophase I in control, Plk1(Δ/Δ) and BI2536‐treated spermatocytes † .

-
A–LFirst column shows the triple immunolabelling of CETN3 (green), PCNT (red) and SYCP3 (grey) on squashed WT mouse spermatocytes. Second column shows the correspondent labellings for Plk1(Δ/Δ). Third column shows signals for BI2536‐treated spermatocytes. Images are shown for (A, E, I) zygotene, (B, F, J) pachytene, (C, G, K) diplotene and (D, H, L) diakinesis. Amplifications at 300% magnification for all labellings are displayed for each image.
-
M–OQuantification of the percentage of cells without PCNT at centrosomes (PCNT‐) in (M) zygotene, (N) pachytene and (O) diplotene in control, Plk1(Δ/Δ) and BI2536‐treated spermatocytes. Data for BI2536 represent results for 100 µM at 8‐h treatment on organotypic cultures of seminiferous tubules. Data are presented as mean ± SD for three biological replicates for each condition.
Data information: Scale bar in L represents 10 µm.
Source data are available online for this figure.
