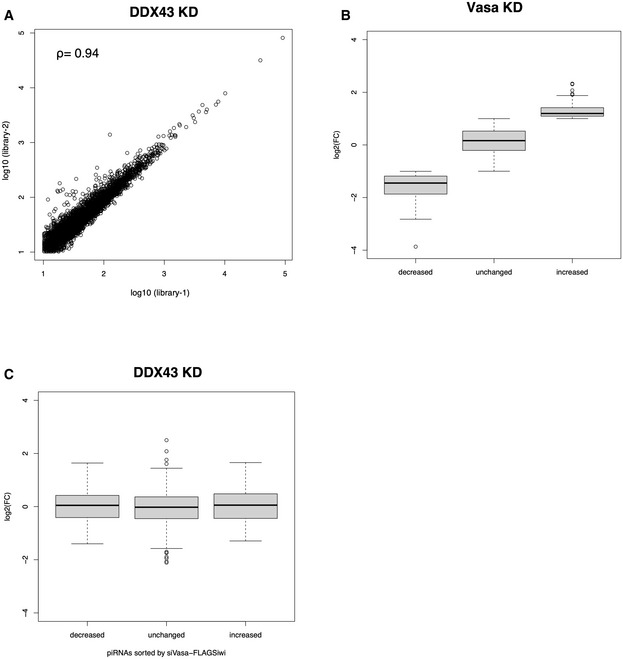
Scatter plot of normalized Flag‐Siwi‐piRNA abundance in two replicate sequencing libraries (library‐1 and library‐2) generated from DDX43‐depleted BmN4 cells (Spearman’s Rho = 0.94). Each data point represents a piRNA sequence.
Boxplot showing the log2‐fold change in the Vasa‐KD (RPM)/Control (RPM) ratios. The piRNAs with a reads per million (RPM) ratio ≥ 2, 0.5 < ratio < 2, or ≤ 0.5 were categorized as increased, unchanged, and decreased, respectively. Median, first and third quartile, maximum and minimum values, and outliers are presented as the central band, boxes, whiskers, and circles. The combined datasets (n = 2, biological replicates) were used for analysis.
Boxplot showing the log2‐fold change in the DDX43‐KD (RPM)/Control (RPM) ratios of piRNAs in the increased, unchanged, and decreased groups as defined in (B). Median, first and third quartile, maximum and minimum values, and outliers are presented as the central band, boxes, whiskers, and circles. The combined datasets (n = 2, biological replicates) were used for analysis.

