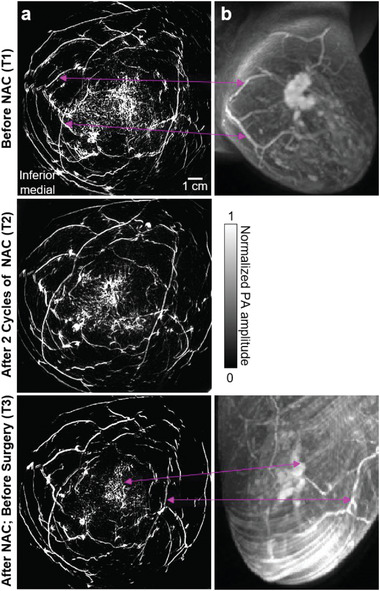
Figure 5.

Comparison of the images acquired by SBH‐PACT and MRI. a) SBH‐PACT angiograms weighted by Figure 4b. b) MRI images of the same breast with dynamic post contrast sequence acquired at T1 and T3 of the NAC treatment. Correlated structures are marked by magenta arrow lines. SBH‐PACT reveals more angiographic details within a single breath hold of 15 s.
