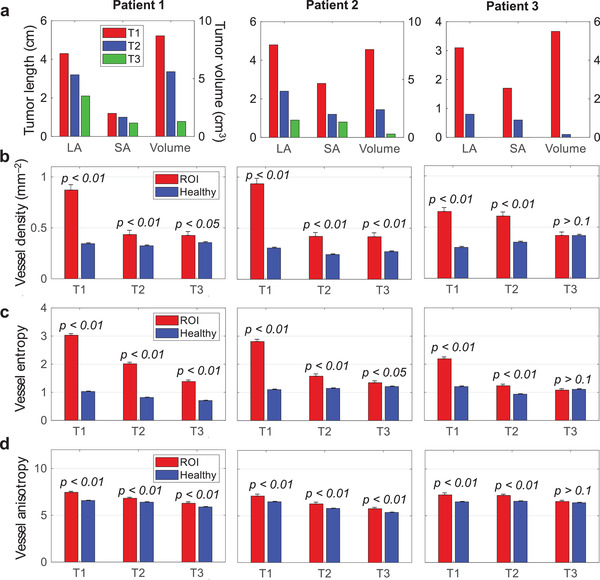
Figure 6.

Quantitative measurements of the tumors’ transformation during the NAC. Statistical data are presented as mean ± standard error; p‐values are calculated using one‐tailed Welch's (unequal variances) t‐test. a) Measurements of tumor dimensions and volume. LA, long axis; SA, short axis. b) Quantification of the relative blood vascular density in the ROI and healthy tissues. c) Quantification of the blood vascular entropy in the ROI and healthy tissues. d) Quantification of the blood vascular anisotropy in the ROI and healthy tissues.
