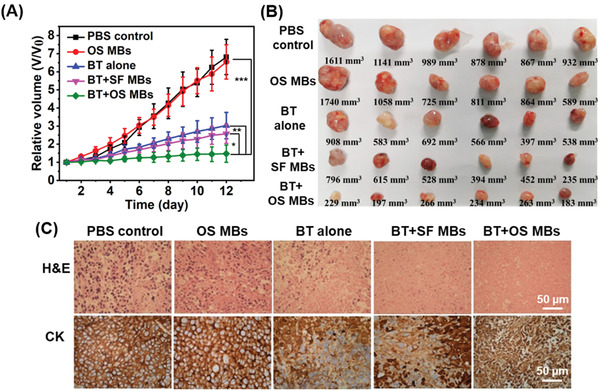
Figure 5.

In vivo brachytherapy treatment. The animal treatment protocol was as follows: 1) 125I seed implantation; 2) administration of OS MBs, and 3) ultrasound destruction of OS MBs. The mice were categorized into five groups: Group 1, administration of PBS (PBS control); Group 2, administration of OS MBs followed by ultrasound activation (OS MBs); Group 3, brachytherapy alone (BT alone); Group 4: brachytherapy with administration of SF MBs followed by ultrasound activation (BT + SF MBs); and Group 5, 125I brachytherapy with administration of OS MBs followed by ultrasound activation (BT + OS MBs). A) Tumor growth curves of different groups with various treatments for twelve days (n = 6, *p = 0.001, **p = 0.001, and ***p = 0.0004). B) Representative images of in vivo volume of tumors harvested from euthanized CNE2 xenograft tumor‐bearing nude mice with different treatments. C) Microscopic images of hematoxylin and eosin (H&E)‐ and cytokeratin (CK)‐stained tumor slices collected from mice of different groups after the twelve‐day post‐treatment. For CK staining, CK appears as a brown color stained with 3,3′‐diaminobenzidine, and the nucleus appears as a blue color stained with hematoxylin.
