Figure 5.

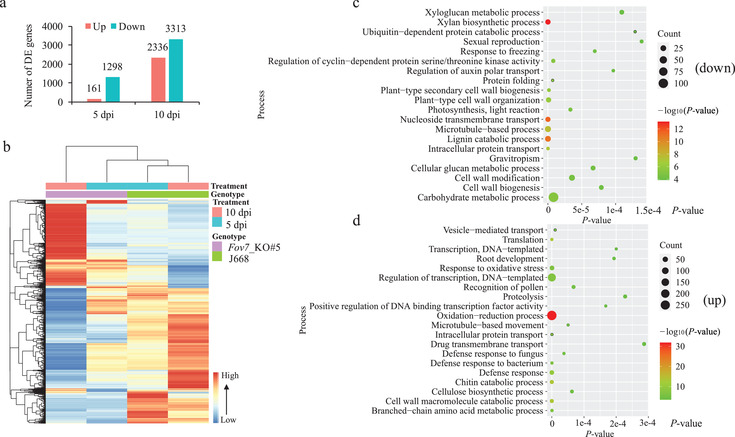
Transcriptome profiles of genes in hypocotyls of J668 and Fov7_KO#5 at various time points after infection with Fov. a) Number of differentially expressed plant genes (DEPGs) (P < 0.05, |log2(FC)| > 2) in hypocotyls of Fov‐infected Fov7_KO#5 versus J668 at different time points after inoculation. Fold change is calculated by inoculated Fov7_KO#5/J668. dpi, days post inoculation. b) Heat map of DEPGs in hypocotyls of Fov7_KO#5 versus J668 at different time points after inoculation. c,d) Gene ontology (GO) enrichment analysis of all c) down‐regulated or all d) up‐regulated genes. TOP 20 significantly enriched biological process GO terms are show. Three biological replicates were included for each treatment.
