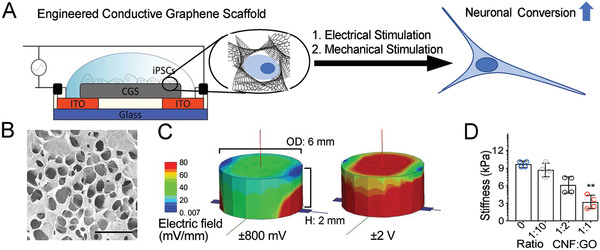
Figure 1.

3D CGS for human iPSC culture. A) Schematic illustration of electrical stimulation chamber, showing iPSCs on a conductive graphene scaffold (CGS) to which a specific voltage and frequency are applied. B) SEM image of the surface morphology of CGS. Scale bar indicates 100 µm. C) Computational simulation of applied electric field spatial distribution on the surface of soft CGS (left, ±800 mV; right, ±2 V). D) Bar graph showing stiffness of CGS (ranging from ≈12 to ≈3 kPa as CNF proportion is increased). D) Analyzed using a one‐way ANOVA, followed by Tukey's HSD post hoc test with * p < 0.05 and ** p < 0.01 compared to 0 ratio CGS. Values represent the mean of independent experiments (n = 4); error bars, SD.
