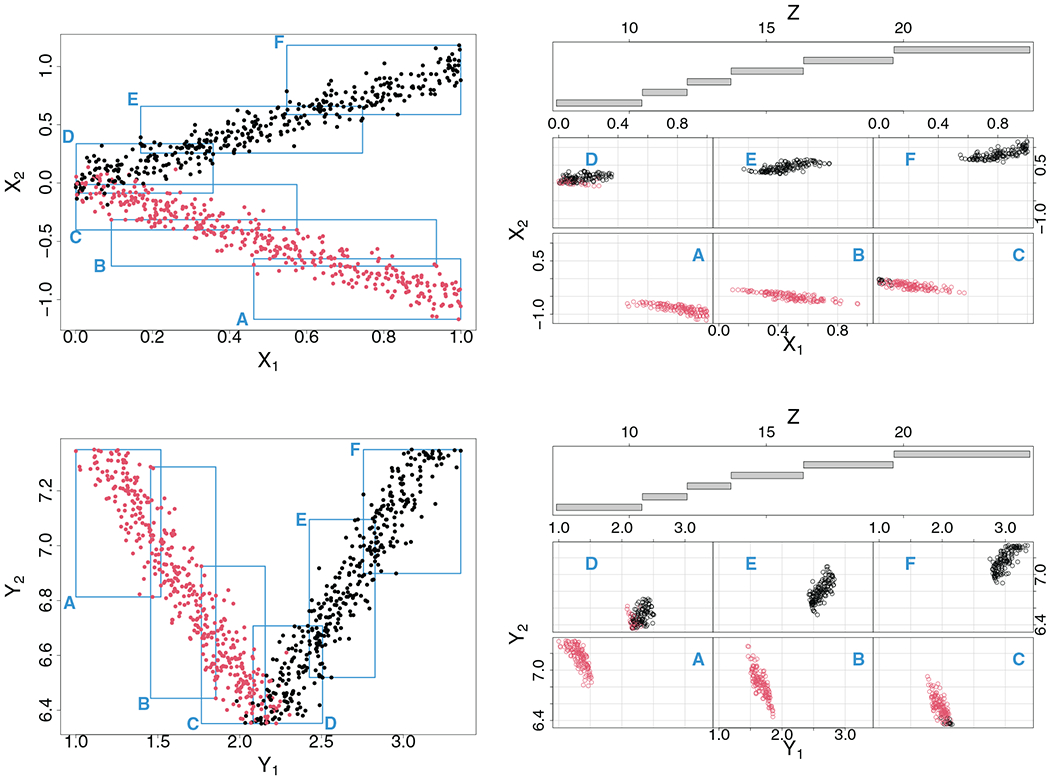
FIGURE 1.

V-shaped two cluster simulation illustrating the basic concept behind sidification and sidClustering. Data are displayed as points on the figures and are colored black and red to indicate cluster membership (observe how points lie along a V-shape). Top right panel shows coplot of original features (X1, X2)T against SID interaction Z = X1 ★ X2. Regions labeled A–E in the coplot are identified by rectangles in the left scatter plot. In the bottom panel, the coplot is displayed in terms of the SID main effects (Y1, Y2)
