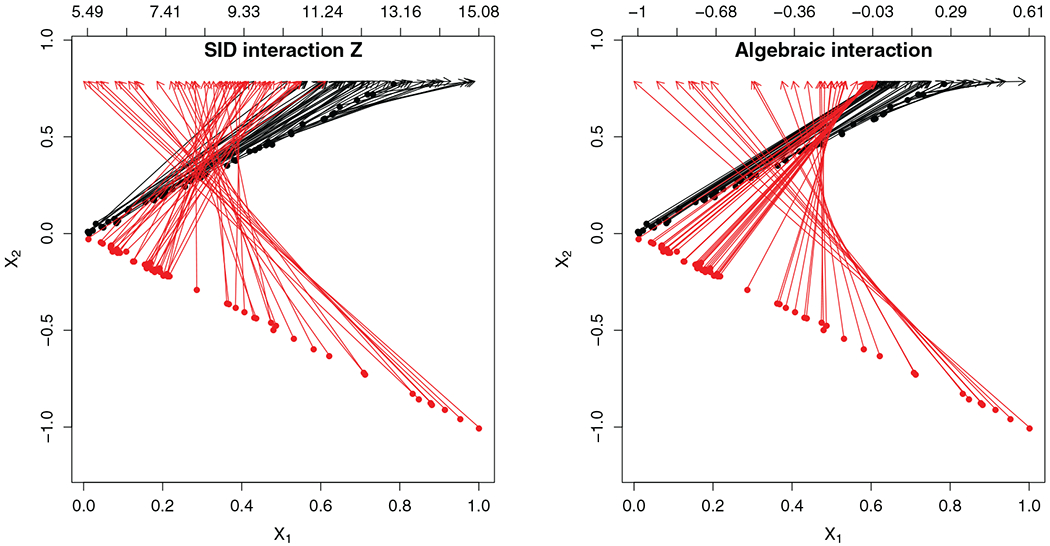
FIGURE 2.

V-shaped two cluster simulation illustrating uniqueness of sidification. Arrows map (X1, X2) points to their interaction value displayed on the second horizontal axis. Left-hand figure shows mapping to the sidified Z interaction. Right-hand figure is the map to the usual algebraic product X1 × X2. Observe the bunching up of arrows indicating lack of uniqueness
