FIGURE 5.

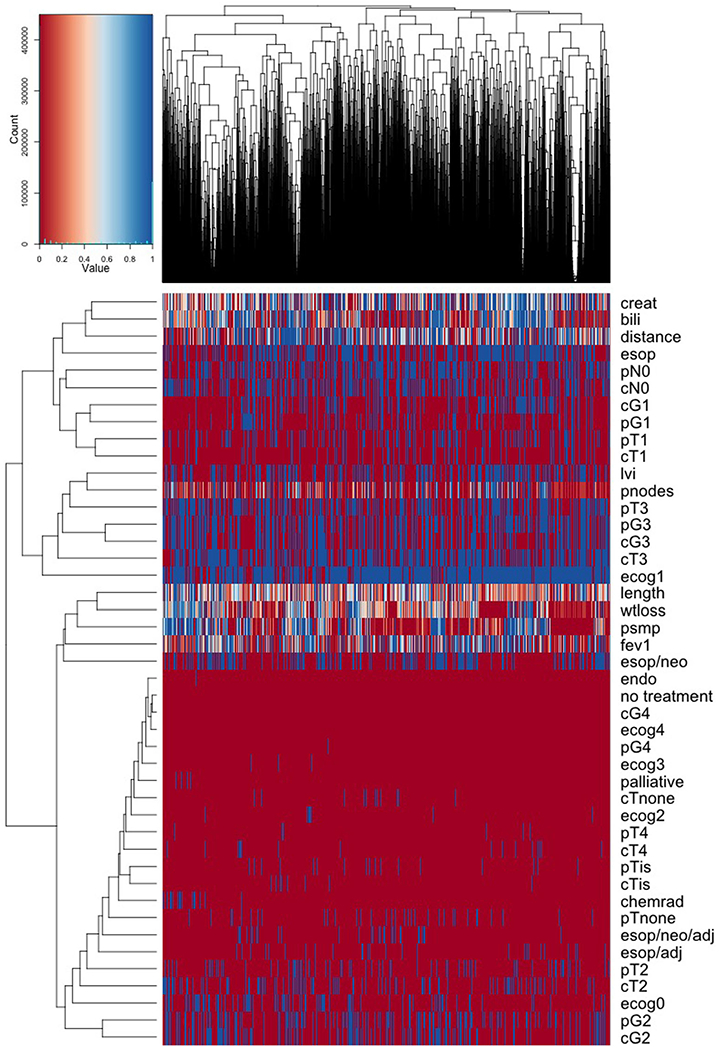
Heatmap from sidClustering analysis of WECC esophageal cancer data where data have been sorted by institution (columns of the heatmap). Rows display patient and cancer characteristics for identifying patient differences across institutions

Heatmap from sidClustering analysis of WECC esophageal cancer data where data have been sorted by institution (columns of the heatmap). Rows display patient and cancer characteristics for identifying patient differences across institutions