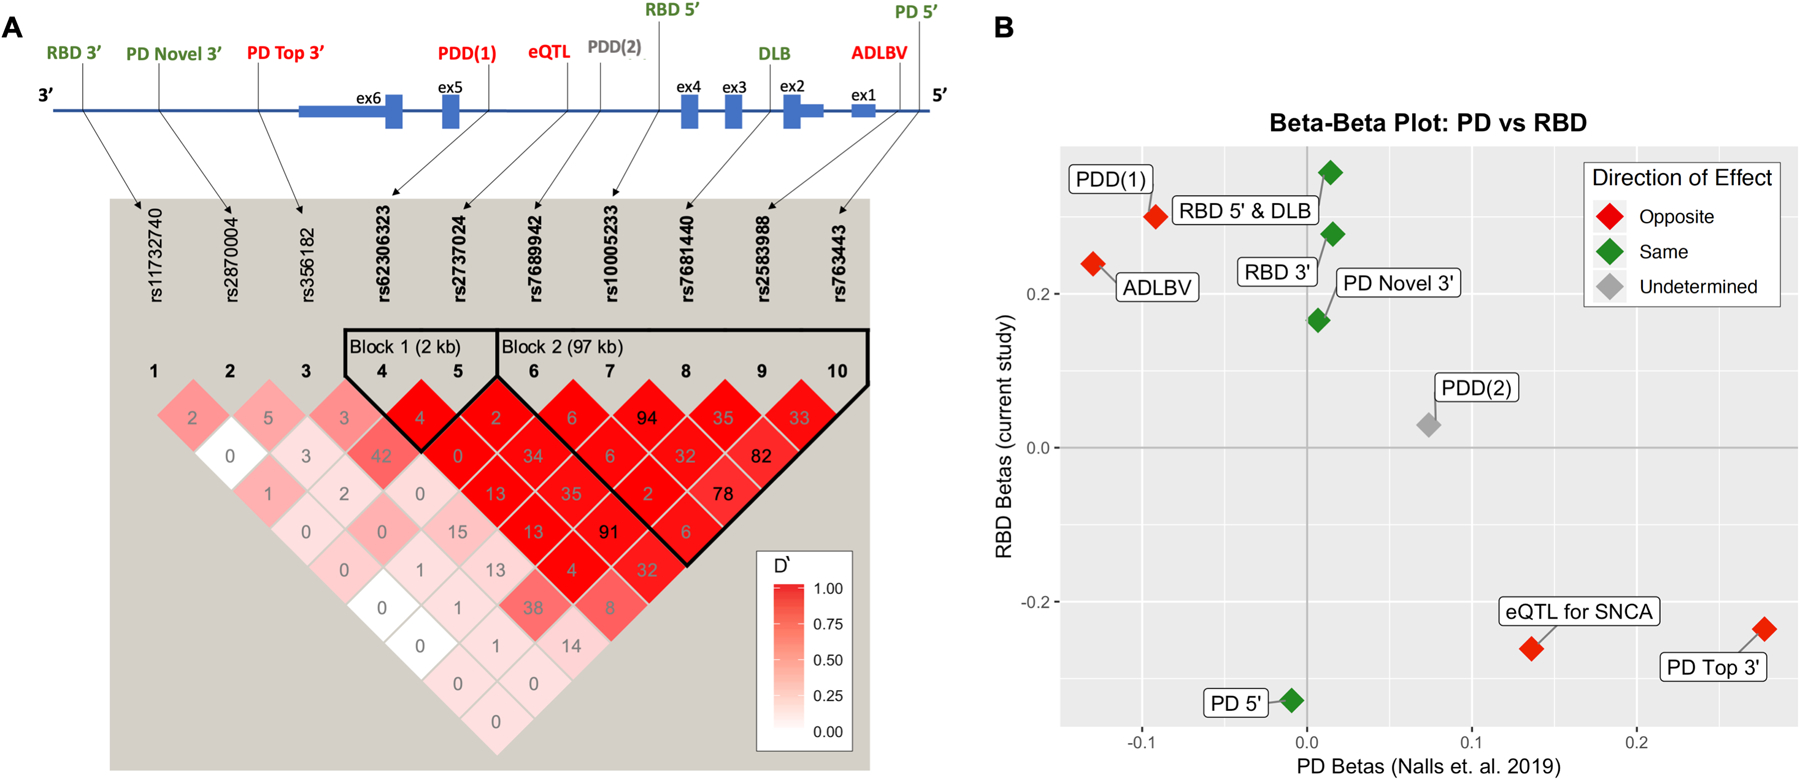
Figure 1. Schematic of top SNCA genetic signals across synucleinopathies with a PD to RBD comparison.

A) A schematic of the SNCA region representing the location of top signals for synucleinopathies and linkage disequilibrium (LD) plot by Haploview. In the LD plot, numbers represent R2 values and deeper color shade represents strength of D’. Of note, when R2 is low and D’ is high, variants are still in strong LD, as the low R2 is a result of differences in allele frequencies, yet high D’ means that the less common SNP is in most cases (or all cases if D’=1) appears on the same allele as the more common SNP. Top RBD signal rs10005233 is in moderate to high LD with all 5’ SNCA SNPs associated with synucleinopathy. The second RBD signal, 3’ rs11732740, is independent and not in LD with previously reported 3’ or 5’ risk variants. Synucleinopathy risk variants are located in the promoter and regulatory regions, with a strong LD block in the 5’ end. B) A beta-beta plot comparing SNCA betas found in the current study (y-axis) to betas from the latest PD GWAS (x-axis). Points in red represent different direction of effect between iRBD and PD, while green represents effect in the same direction. Interestingly, the strongest risk variants for PD at the 3’ of the gene are less common in RBD (marked as “PD Top 3’” and “eQTL for SNCA”).
