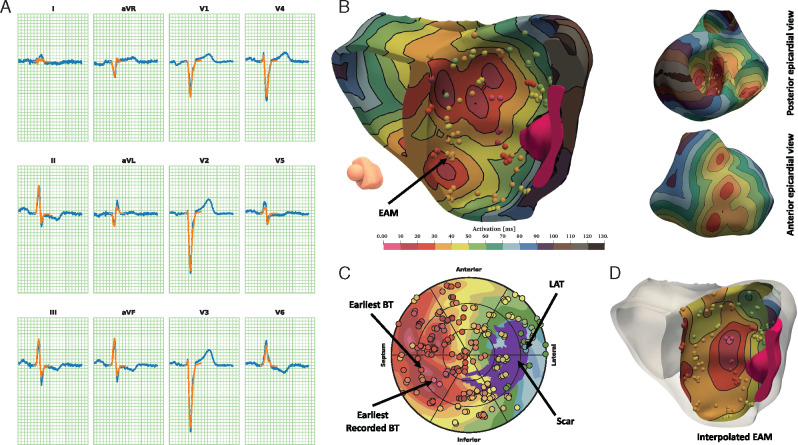
Figure 2.
Illustrative reconstruction. Example of the activation reconstruction for Patient #4. (A) Recorded (blue) and fitted (orange) ECG. (B) 3D cut view of the activation map with collected EAM points, and epicardial views. (C) LV bull’s-eye plot. (D) LV endocardial view of interpolated EAM (scar in purple). EAM, electro-anatomical maps; ECG, electrocardiogram; LV, left ventricular.

