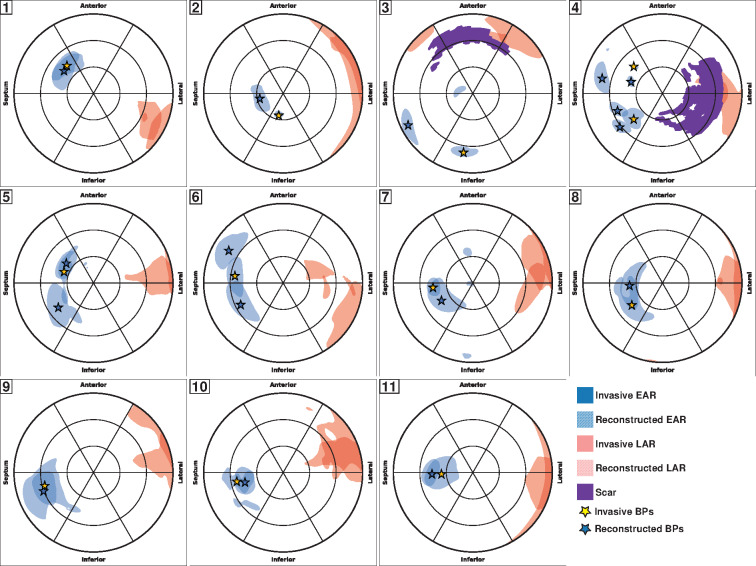
Figure 3.
Validation against invasive mapping. Bull’s-eye plots for each patient showing the EAR (blue) and LAR (red) in the LV. The solid-coloured regions refer to the recorded maps, while the hatched-coloured regions are the reconstructed ones. Scar is in purple. BPs are marked by stars. BP, breakthrough point; EAR, earliest activated region; LAR, latest activated region; LV, left ventricular.

