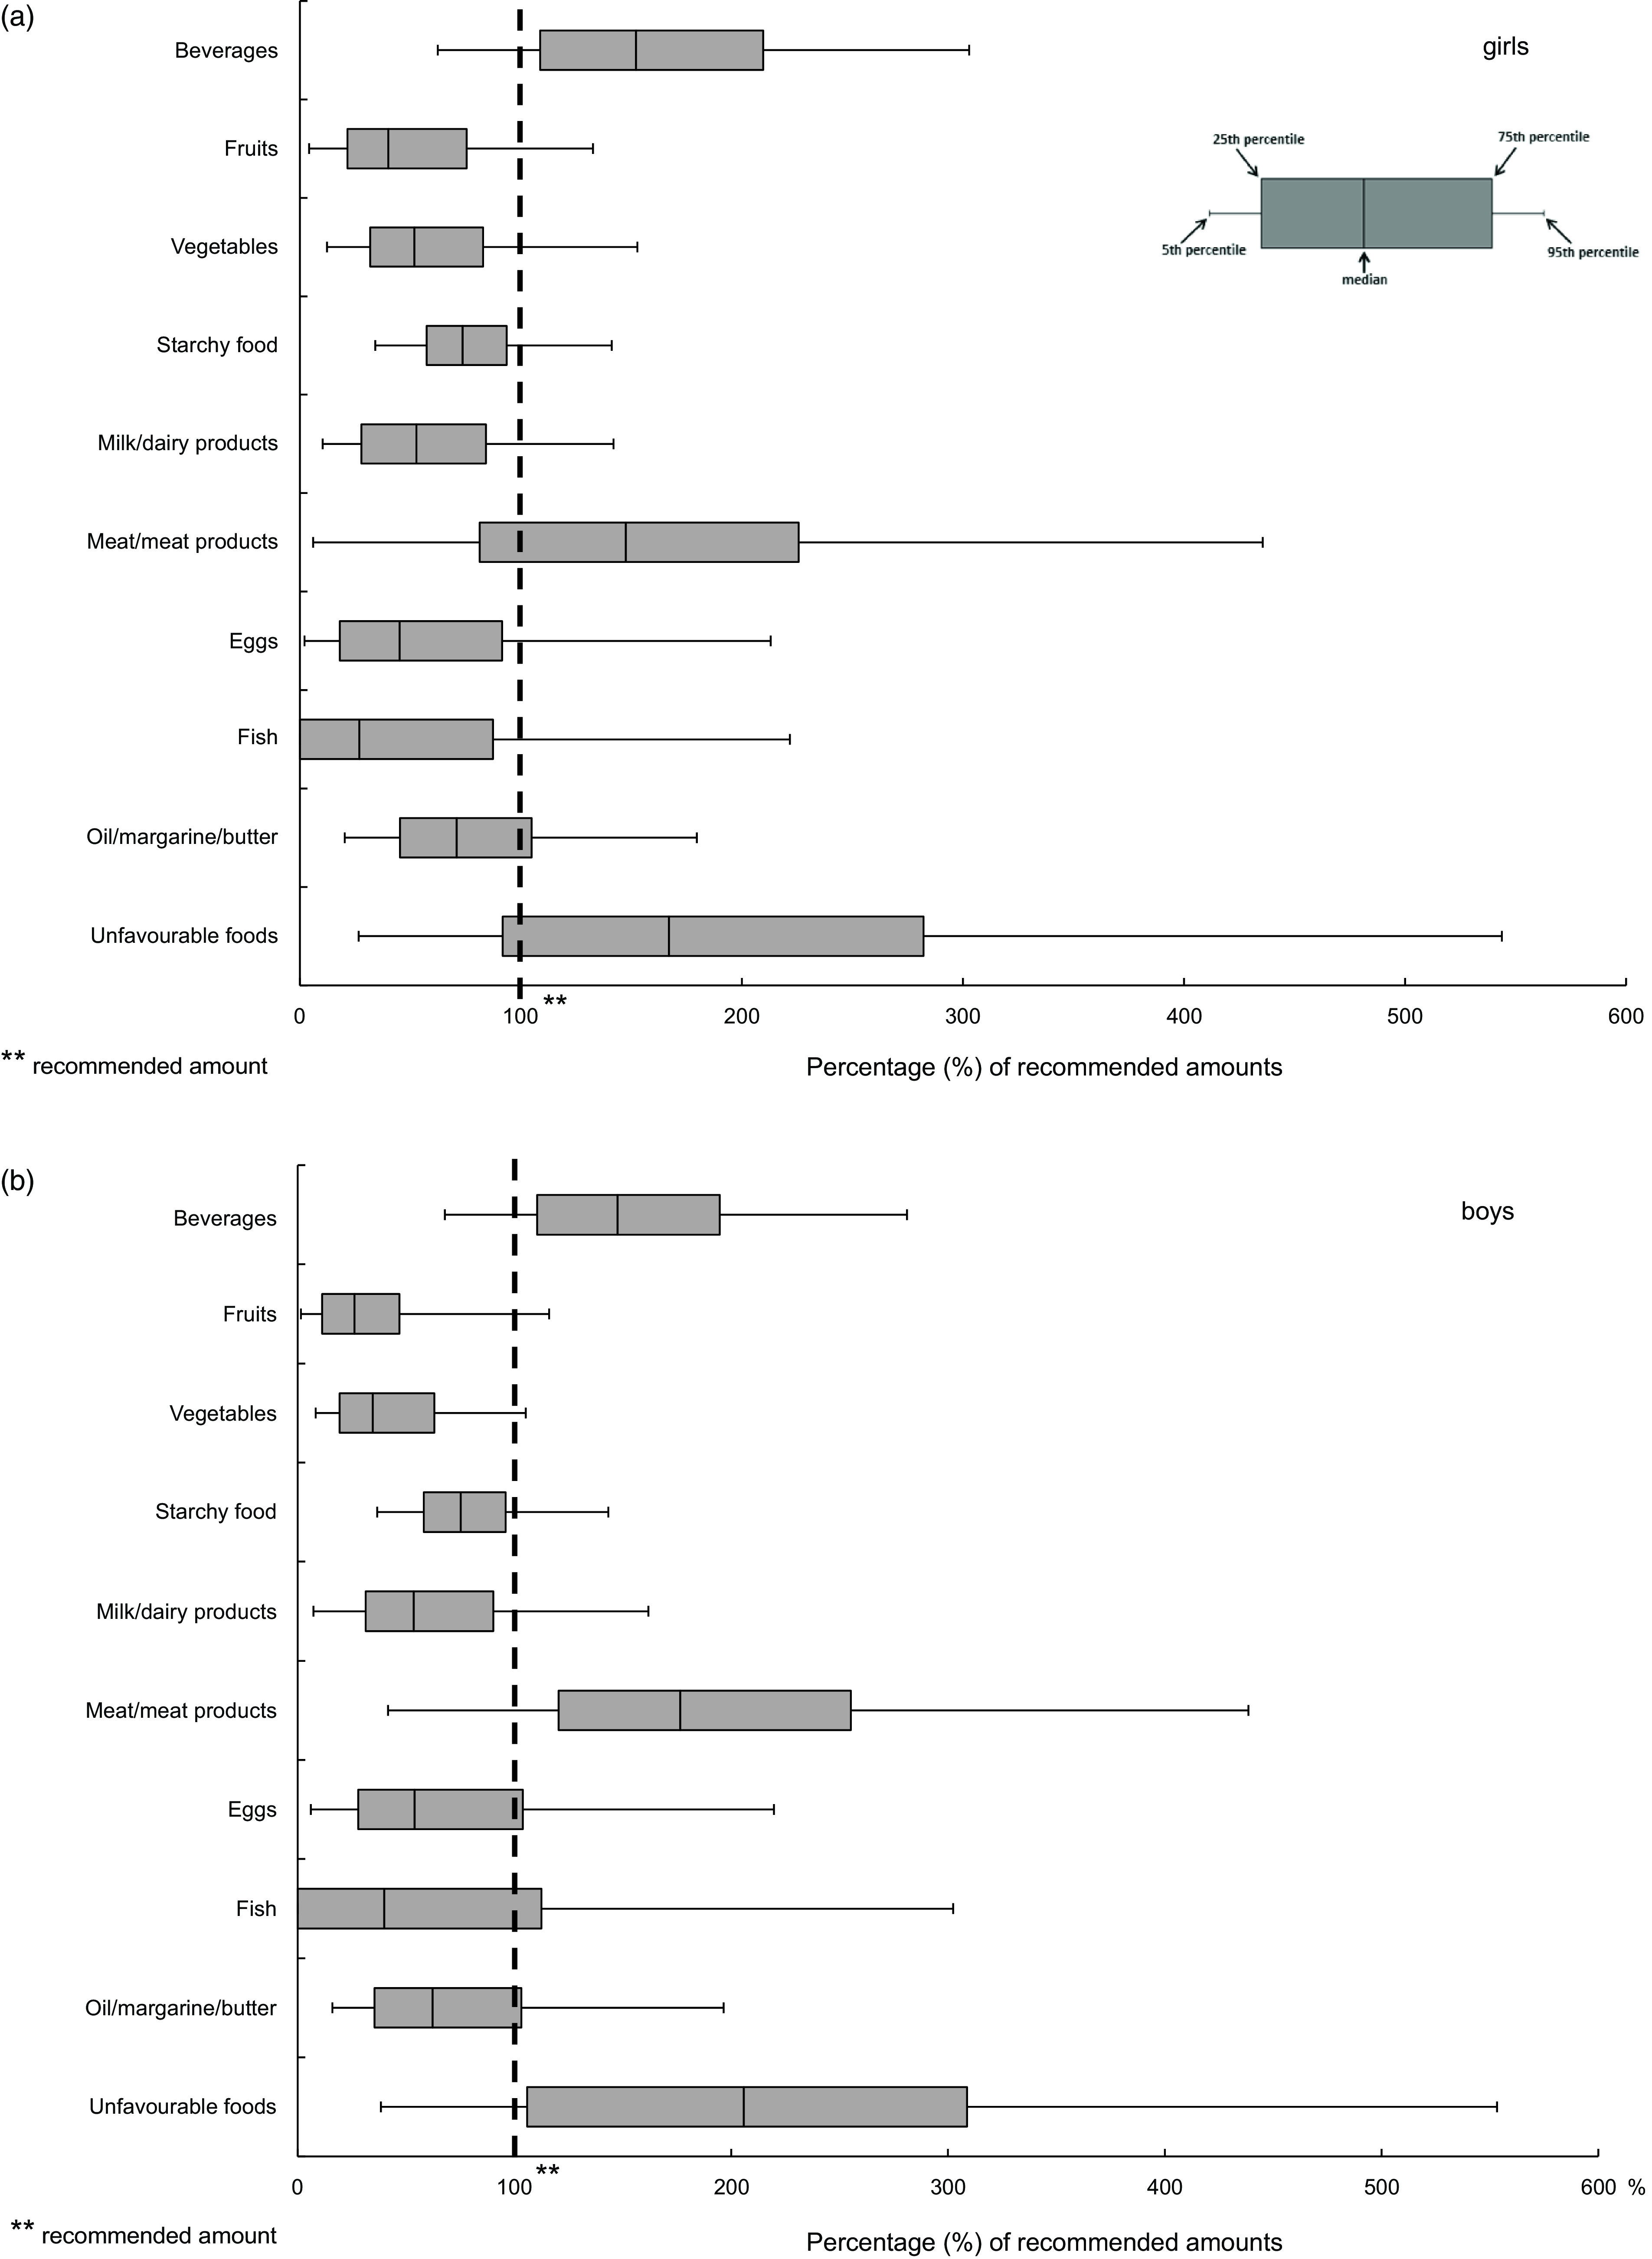
Fig. 1.

Distribution of food consumption expressed as the proportion of the recommended amounts for an OMD among 12- to 17-year-old (a) girls and (b) boys in EsKiMo II (n 1353) (Box–Whisker plots*) * Box–Whisker plots with the inner box corresponding to the interquartile range around the median and the whiskers corresponding to the 5th and 95th percentiles
