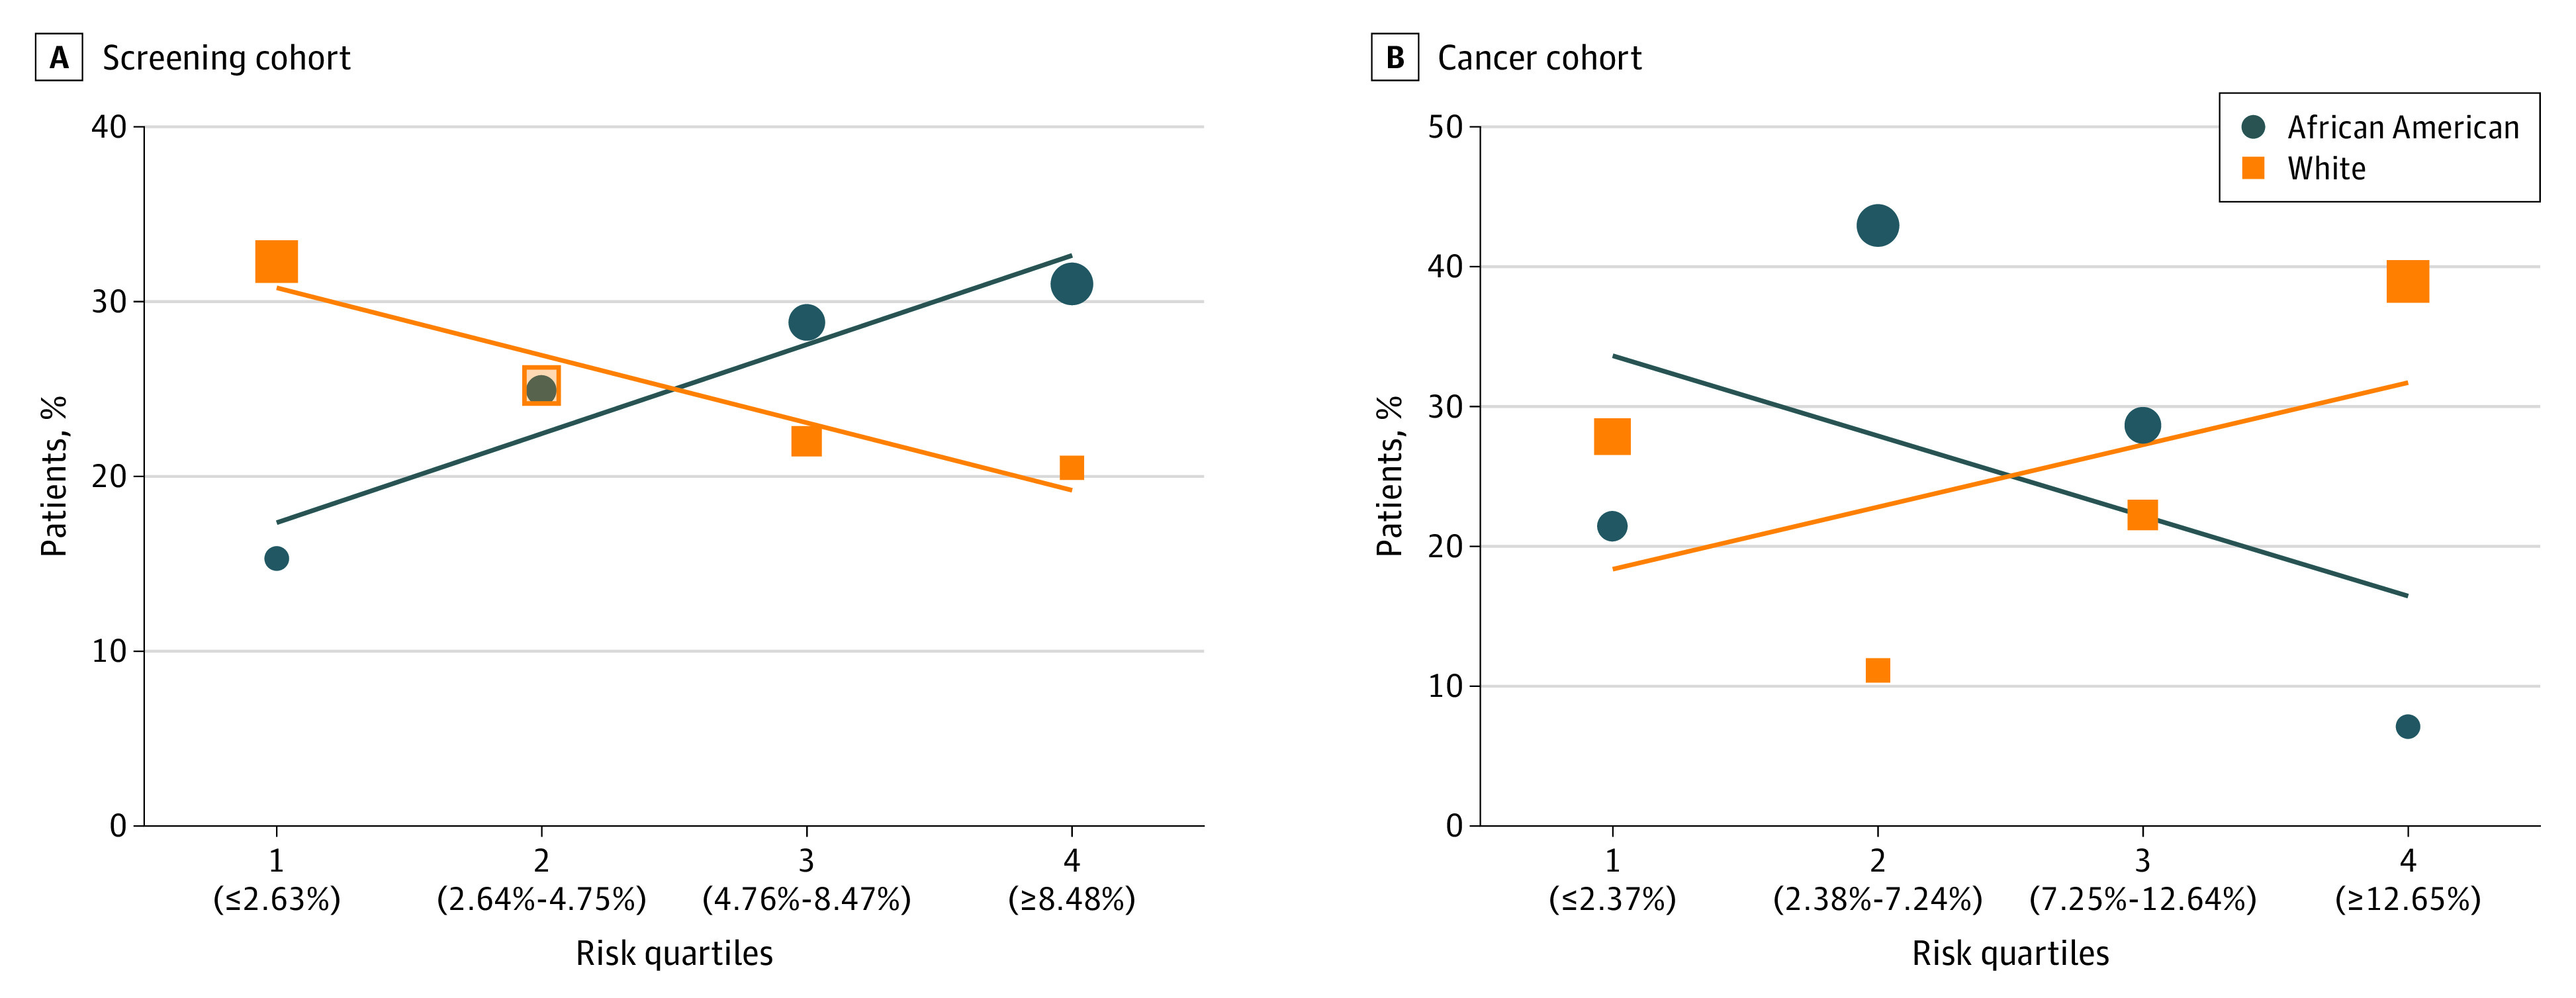
Figure. Six-Year Lung Cancer Risk Among the Screening and Cancer Cohorts by Risk Quartile.

A, Percentage of patients who underwent lung cancer screening in each risk quartile by race. African American and White individuals have overlapping percentages, with 24.9% and 25.2% of each cohort in risk quartile 2. B, Percentage of patients who had a screen-detected lung cancer in each risk quartile by race. The size of each data icon is proportional to the number of patients in each risk quartile. Risk quartiles are determined by median PLCOm2012 risk values (with cutoffs shown in parentheses along the x-axis).
