Abstract
The human gastrointestinal microbiota is increasingly linked to health outcomes; however, our understanding of how specific foods alter the microbiota is limited. Cruciferous vegetables such as broccoli are a good source of dietary fiber and phytonutrients, including glucosinolates, which can be metabolized by gastrointestinal microbes. This study aimed to determine the impact of broccoli consumption on the gastrointestinal microbiota of healthy adults. A controlled feeding, randomized, crossover study consisting of two 18-day treatment periods separated by a 24-day washout was conducted in healthy adults (n=18). Participants were fed at weight maintenance with the intervention period diet including 200 g of cooked broccoli and 20 g of raw daikon radish per day. Fecal samples were collected at baseline and at the end of each treatment period for microbial analysis. Beta diversity analysis indicated that bacterial communities were impacted by treatment (P=0.03). Broccoli consumption decreased the relative abundance of Firmicutes by 9% compared to controls (P=0.05), increased the relative abundance of Bacteroidetes by 10% compared to controls (P=0.03), and increased Bacteroides by 8% relative to controls (P=0.02). Furthermore, the effects were strongest among participants with BMI < 26 kg/m2, and within this group there were associations between bacterial relative abundance and glucosinolate metabolites. Functional prediction revealed that broccoli consumption increased the pathways involved in the functions of the endocrine system (P=0.05), transport and catabolism (P=0.04), and energy metabolism (P=0.01). These results reveal that broccoli consumption affects the composition and function of the human gastrointestinal microbiota.
Keywords: microbiome, cruciferous vegetables, brassica vegetables, glucosinolates, Bacteroides
1. Introduction
Diet is a contributing factor to the development of noncommunicable diseases including cancer, obesity, and gastrointestinal diseases. There is growing evidence linking these diet-induced metabolic and gastrointestinal diseases with dysbiosis of the microbiota [1]. The human gastrointestinal microbiota is a collection of trillions of bacteria that reside throughout the gastrointestinal tract and provide many metabolic functions for the host. Notably, these bacteria can metabolize dietary components that are indigestible by human digestive enzymes, thereby aligning diet as an important modulator of the interrelationship between diet, the microbiota, and human health.
Clinical research continues to demonstrate connections between diet and the composition and function of the bacteria that make up the gastrointestinal microbiota. Long-term dietary patterns [2], acute and dramatic changes in the macronutrient composition of the diet [3], eating behaviors such as eating frequency and overnight fast duration [4], and consumption of isolated supplemental dietary fibers [5] have all been shown to impact the composition and function of the human gastrointestinal microbiota. More recently, we have also begun to better understand how certain foods [6,7], which provide a source of dietary fiber and unique phytochemical composition, may also play a role in shaping the community structure of the human gut microbiota.
Broccoli provides a good source of dietary fiber as well as glucosinolates. Glucosinolates are phytochemicals that contain a conserved structure, a variable side chain, and a glucose molecule attached by a sulfur bond [8]. The gastrointestinal microbiota can metabolize the relatively non-bioactive glucosinolates into bioactive isothiocyanates (ITCs) [9], which slow cancer in humans [10]. In our previous study, we demonstrated in a rodent model that the consumption of broccoli altered the gastrointestinal microbiota structure to improve the ex vivo hydrolysis of glucosinolates [11].
Whereas studies show that consumption of specific dietary fibers and isolated phytonutrients impact the composition and function of the human gastrointestinal microbiota, there is far less knowledge on the impact of consumption of specific foods such as broccoli on the human gastrointestinal microbiota. In this work, we aimed to advance our knowledge of the impact of broccoli consumption on the gastrointestinal microbiota in a controlled feeding trial in humans. Specifically, we aimed to determine the impact of broccoli consumption on abundance of bacterial taxa and the functional potential of the microbial community. We hypothesized that broccoli consumption would alter the composition and functional capacity of the human gastrointestinal microbiota compared to control.
2. Materials and Methods
2.1. Participants
The study described herein was a single-blind, randomized, crossover, complete feeding intervention that took place at the United States Department of Agriculture, Agricultural Research Service, Beltsville Human Nutrition Research Center in Beltsville, MD from January 2015 – April 2015. All procedures were approved by the Institutional Review Board of the MedStar Health Research Institute. The study was registered with Clinicaltrials.gov as NCT02346812. Participants were healthy adults (n=18, females=10). Inclusion criteria included that participants be 21–70 years of age, not currently taking glucosinolate or ITC-containing supplements, and be free of cancer (i.e. never diagnosed or cancer-free for at least 5 years). Exclusion criteria were as follows: (1) pregnant, lactating, or intending to become pregnant during the study period, (2) known allergy or intolerance to Brassica vegetables, (3) history of bariatric surgery, nutrient malabsorption disease, or metabolic disorder requiring special diet recommendations, (4) use of tobacco products, (5) use of medications that may interfere with study objectives, (6) type 2 diabetes requiring the use of medication, (7) use of blood-thinning medications, and (8) self-report of alcohol or substance abuse within the past 12 months and/or current acute treatment or rehabilitation for these problems. Participants were asked to abstain from consumption of Brassica vegetables for three weeks before the study initiation.
2.2. Treatments
Subjects participated in two complete feeding diet treatment periods, during which breakfast and dinner were consumed on site to observe compliance. Subjects were randomly allocated to one of two groups (broccoli period first or control period first) by using stratified randomization to ensure balance of GSTM1 genotype, BMI, sex, and age. The 18-day diet periods were separated by a 24-day washout. Participants received complete feeding at weight maintenance during the entirety of each treatment period and were fed on a 7-day menu cycle. The control diet was prepared using traditional American foods, excluding all Brassica vegetables, with a macronutrient composition representative of a typical American diet (54% of calories from carbohydrates, 30% of calories from fat, 16% of calories from protein) [12]. During the broccoli intervention period, participants consumed the same base diet with the addition of 200 g of cooked broccoli each day for the first 15 days. The broccoli was prepared by microwave steaming from frozen, and 20 g raw daikon radish was added to provide a source of myrosinase to hydrolyse the glucosinolates to the active bioactive compounds following consumption, mimicking raw broccoli consumption without sacrificing consistency of glucosinolate concentration by purchasing new batches of fresh broccoli over the duration of the study. Half of the broccoli (100 g) and half of the radish (10 g) were served at breakfast and the remaining half at dinner, except for day 16 on which the dinner serving of broccoli and radish were withheld to prevent metabolite carry-over to the next day. On day 17, all subjects in both periods consumed 200 g of broccoli, 20 g of daikon radish, a 100-gram roll and 10 g margarine for breakfast prior to 24-hour metabolite testing until the morning of day 18, as described elsewhere [13]. During the diet periods, subjects were instructed to eat all foods and only foods provided to them, with the exception of water, coffee, tea, and diet soda. Alcohol consumption was not allowed during the intervention. Subjects were asked to abstain from vitamin, mineral, and herbal supplements beginning 3 weeks prior to the study and continue to abstain for the duration of the study.
2.3. Fecal microbial analysis
Fecal samples were collected either the evening before or the morning of day 1, and either the evening before or the morning of day 16, based on the ability of the subjects to produce a sample. Baseline samples were provided prior to test meals. Samples were kept in Ziploc bags with ice packs in a cooler until returned for processing. They were then immediately homogenized and stored at −80°C for further analysis. Samples were shipped on dry ice to the University of Illinois at Urbana-Champaign. Fecal bacterial DNA was extracted according to the manufacturer’s instructions by using the PowerLyzer PowerSoil DNA Isolation Kit (MO BIO Laboratories, Inc., Carlsbad, CA). After extraction, the V4 region of the 16S bacterial rRNA gene was amplified using a Fluidigm Access Array system prior to high-throughput sequencing on an Illumina MiSeq, as previously described [14]. Sequencing was performed at the W. M. Keck Center for Biotechnology at the University of Illinois. High-quality sequence data derived from the sequencing process were analyzed with QIIME 1.8.0 and 1.9.1 [15]. Briefly, sequences were clustered into operational taxonomic units (OTUs) by using closed-reference OTU picking against the Greengenes 13_8 reference OTU database (97% similarity threshold). After quality filtering, alpha and beta diversity were calculated at an even sampling depth of 33,311 sequences per sample [16,17].
2.4. Quantitative PCR
Quantitative polymerase chain reaction was performed on Bacteroides vulgatus and Bacteroides thetaiotaomicron, strains of which have been shown to utilize glucosinolates in preclinical models [18,19]. The standard curves were generated using genomic DNA of type strains (B. vulgatus ATCC 8482 and B. thetaiotaomicron ATCC 29741) as templates. DNA extraction from pure bacterial cultures was performed using the same extraction kit as for the fecal samples. B. vulgatus ATCC 8482 and B. thetaiotaomicron ATCC 29741 were grown on Wilkins-Chalgren media (Neogen, Lansing, MI) anaerobically at 37°C.
For quantification of B. vulgatus, primers were chosen based the work of Wang et al., 1996 and Wu et al., 2010 (Table 1) [20,21]. These primers were chosen based on the variable regions of the 16S rRNA by ALIGN program, and the primer specificity was confirmed by BLAST search to ensure that the primers were complementary with B. vulgatus but not with other species [20]. Each qPCR reaction consisted a volume of 10 μl [5 μl 2× Power Sybr Green master mix (Thermo Fisher Scientific, Waltham, MA), 1 μl bovine serum albumin (BSA; 20 mg/mL) (New England Biolabs, Ipswich, MA), 1 μl molecular grade water, 0.5 μl of each primer (10 μM) (Integrated DNA Technologies, Coralville, IA) [21], and 2 μl of DNA template (4 ng total DNA)]. Cycling conditions for B. vulgatus were as follows: 1 cycle at 95°C for 5 minutes followed by 40 cycles at 95°C for 10 seconds, 55°C for 15 seconds, and 72°C for 50 seconds.
Table 1:
Primer sequences for quantitative PCR of B. vulgatus and B. thetaiotaomicron
| Sequence | Target gene | Amplicon size (bp) | Reference | ||
|---|---|---|---|---|---|
| B. vulgatus | Forward | GCATCATGAGTCCGCATGTTC | 16s rRNA | 287 | Wu, 2010 [21] |
| Reverse | TCCATACCCGACTTTATTCCTT | ||||
| B. thetaiotaomicron | Forward | GCTTAATTTGCCTGTCTATCTCCT | α-1,6-mannanase | 75 | This study |
| Reverse | TGTTCCTTTCATCATTTGTCTCC |
For quantification of B. thetaiotaomicron, primers specific for this microorganism were designed using the Universal Probe Library (Roche Life Science, Indianapolis, IN). The specificity of these primers was experimentally confirmed by their ability to amplify genomic DNA from a pure culture of B. thetaiotaomicron and inability to amplify genomic DNA from a pure culture of the closely related B. vulgatus and was additionally confirmed by BLAST search to ensure that primers were not complementary with other species. Each PCR reaction for B. thetaiotaomicron had a 20 μl volume, consisting of 10 μl Taqman Universal PCR Master Mix (Thermo Fisher Scientific, Waltham, MA), 3.9 μl molecular grade water, 1.8 μl of each primer (10 μM) (Integrated DNA Technologies, Coralville, IA), 0.5 μl of Universal Probe Library Probe #133 (10 μM) (Roche Life Science, Indianapolis, IN) and 2 μl of DNA template (4 ng total DNA). Cycling conditions for B. thetaiotaomicron were 1 cycle at 50°C for 2 minutes, 1 cycle at 95°C for 10 minutes, and 40 cycles at 95°C for 15 seconds, 55°C for 30 seconds, and 68°C for 45 seconds.
All qPCR reactions were performed on a QuantStudio 7 system at the W. M. Keck Center for Biotechnology at the University of Illinois.
2.5. Metabolites
On day 17, time series plasma sampling and 24-hour urine collection was initiated as described in detail elsewhere [13]. Briefly, blood was collected immediately before the broccoli challenge meal and at 0.5, 1.0, 1.5, 2.0, 2.5, 3.0, 3.5, 4.0, 5.0, 6.0, and 24 h thereafter, whereas urine was collected during the intervals 0-2, 2-4, and 4-6 h at the study site and from 6-24 h off site. Samples were processed, stored, and analyzed as previously described [13].
2.6. Statistics
Statistical analysis of bacterial taxa was performed using SAS 9.4 (SAS Institute, Inc., Cary, NC). A probability of P ≤ 0.05 was accepted as statistically significant and P ≤ 0.1 as a trend. Bacterial abundance change from baseline was calculated for each treatment, and paired t-tests were performed between treatments. Beta diversity comparison was a non-parametric test with Bonferroni adjustment for multiple comparisons. Statistical tests of differences in functional prediction were done in STAMP version 2.1.3 using one-way ANOVA with post-hoc Tukey test [22].
3. Results
Demographic characteristics of participants are presented in Table 2. There were no differences observed between the bacterial relative abundances at the start of each period, indicating adequacy of washout length. No differences were observed by sex. There were no differences in bacterial abundance change from baseline between GSTM1 present and absent participants during the control period. During the broccoli diet period, there were no significant differences in bacterial abundance change from baseline, but subjects with GSTM1 absent tended to have a greater increase in Bacteroidetes (P=0.09) and a greater increase in the Bacteroidetes to Firmicutes ratio (P=0.08), whereas those with GSTM1 present tended to have an increase in B. thetaiotaomicron (P=0.06) (Supplemental Figures 1–2).
Table 2:
Demographic characteristics of sample
| Participants | n=18 (females=10) | ||
|---|---|---|---|
| Mean | SD | Range | |
| Age (years) | 55 | 7 | 37-65 |
| BMI (kg/m2) | 27.5 | 5 | 19.0-36.6 |
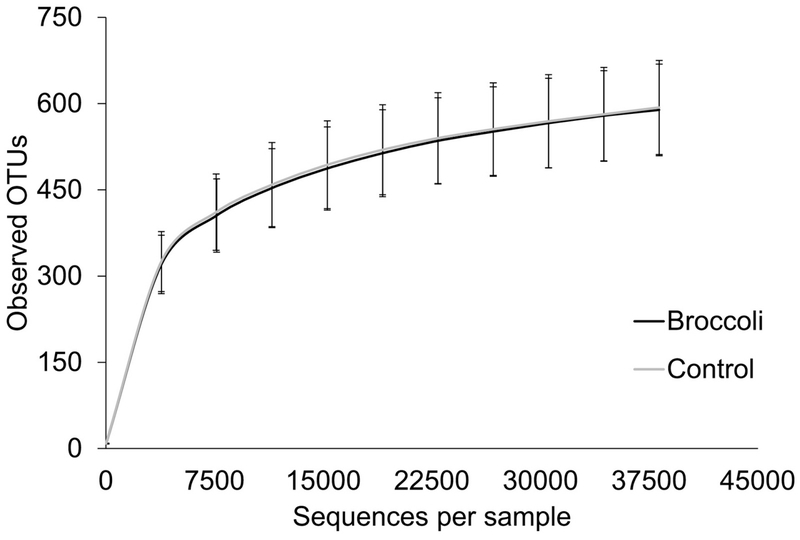
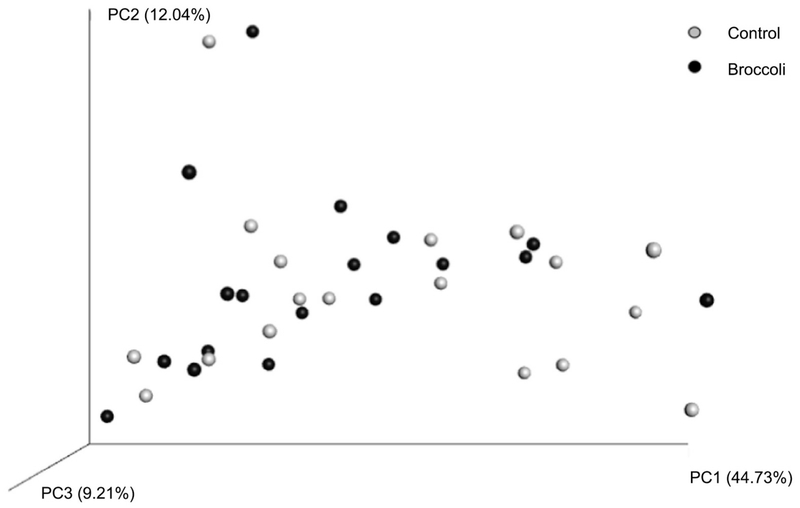
There were no differences in alpha diversity between the two treatment periods (Figure 1). Among beta diversity measurements, weighted Unifrac distances revealed differences between the two treatments (Figure 2). Specifically, distances between samples were smaller following broccoli consumption than following the control period (Bonferroni adjusted P=0.03), indicating that the individuals’ microbial community structures were more similar to each other following the broccoli consumption period.
Figure 1:
Alpha diversity as measured at the end of each treatment period. Alpha diversity was not significantly different between treatments. n=18 per group.
Figure 2:
Beta diversity as measured by weighted Unifrac distances at the end of each treatment period. Bonferroni-adjusted P value indicates that distances within the broccoli group are significantly smaller than distances within the control group (P=0.03). n=18 per group.
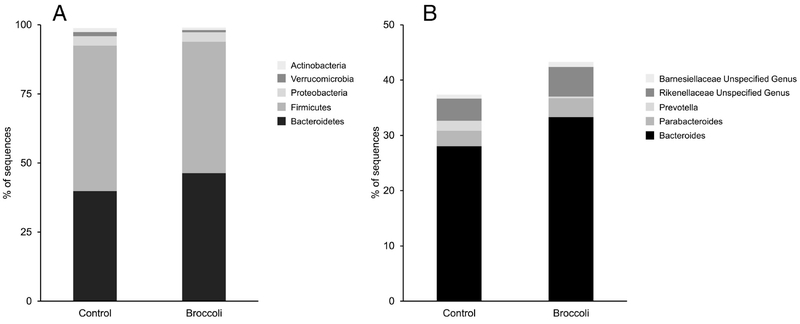
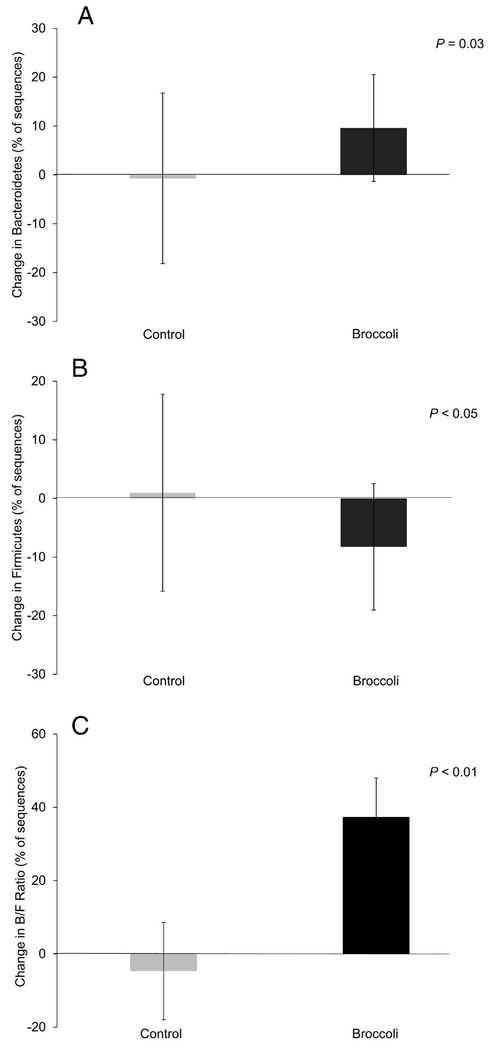
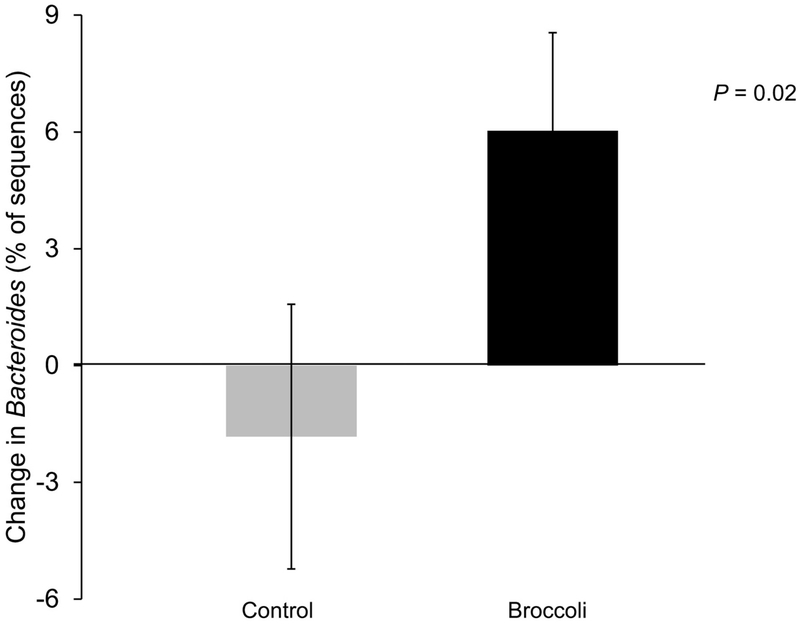
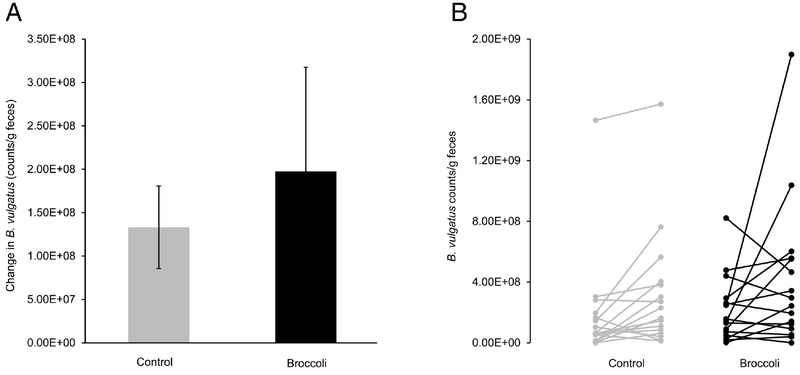
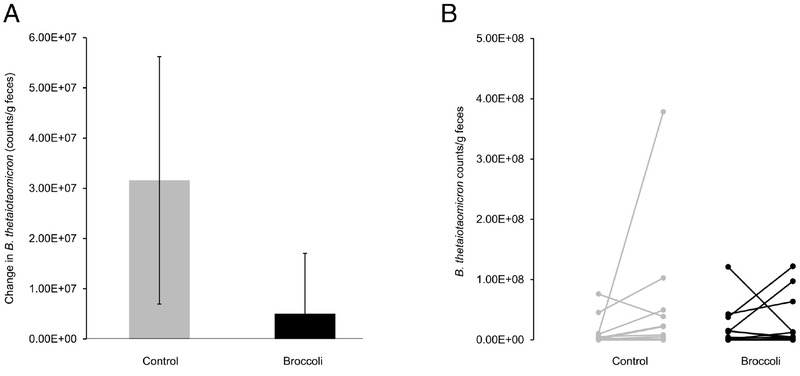
The five most abundant phyla and five most abundant genera within the Bacteroidetes phylum are presented in Figure 3. At the end of the broccoli consumption period, the Bacteroidetes phylum had increased (P =0.03) by 10%, whereas the Firmicutes decreased (P=0.05) by 8% (Figure 4A–B). The ratio of Bacteroidetes to Firmicutes thus increased (P=0.01) by 37% from baseline, compared to a decrease of 5% during the control period (Figure 4C). The Bacteroides genus increased (P=0.02) by 6% following broccoli consumption, compared to a 2% decrease during the control period (Figure 5). Bacteroides virfgatus and Bacteroides thetaiotaomicron were not significantly different between the two groups but showed high inter-individual variation (Figures 6–7).
Figure 3:
Most abundant taxa present at the end of each treatment period. A) Five most abundant operational taxonomic units at the phyla level. B) Five most abundant operational taxonomic units at the genus level within the Bacteroidetes phylum. n=18 per group.
Figure 4:
Change in relative abundance from baseline to end within each treatment period. A) Bacteroidetes. B) Firmicutes. C) Ratio of Bacteroidetes relative to Firmicutes. (Mean ± SD; n=18 per group.)
Figure 5:
Change in relative abundance of the Bacteroides genus from baseline to end within each treatment period. (Mean ± SD; n=18 per group.)
Figure 6:
A) Change in Bacteroides vulgatus counts/g feces, as measured by quantitative PCR, from baseline to end within each treatment period. (Mean ± SD; n=18 per group.) B) Change within individual subjects of Bacteroides vulgatus counts/g feces, as measured by quantitative PCR, from baseline to end within each treatment period; each line connects one subject’s baseline reading (on the left) to their own end value (on the right). n=18 per group.
Figure 7:
A) Change in Bacteroides thetaiotaomicron counts/g feces, as measured by quantitative PCR, from baseline to end within each treatment period. (Mean ± SD; n=18 per group.) B) Change within individual subjects of Bacteroides thetaiotaomicron counts/g feces, as measured by quantitative PCR, from baseline to end within each treatment period; each line connects one subject’s baseline reading (on the left) to their own end value (on the right). n=18 per group. Bacteroides thetaiotaomicron was not detected in 19 of the 72 total fecal samples.
We previously reported no main effect of treatment on plasma or urine metabolites in this study, but an interesting dichotomy was revealed whereby participants with BMI < 26 kg/m2 (median) had an increase in metabolites after broccoli treatment, but participants with BMI > 26 kg/m2 had the opposite effect [13]. To determine if the microbiota also showed this pattern, our data were bifurcated by BMI. In the low BMI group, the ratio of Bacteroidetes to Firmicutes increased (P=0.04) by 32% from baseline, compared to a decrease of 26% during the control period (Supplemental Figure 3). The relationships with Bacteroidetes (P=0.09) and Bacteroides (P=0.06) tended to be numerically similar to the full sample (Supplemental Figures 3–4). In the high BMI group, none of the relationships were significant, indicating that our overall findings are driven by the lower BMI group (Supplemental Figures 5–6).
To further analyze associations in the low BMI group, bivariate correlations were performed between metabolites and bacterial relative abundances. The change from baseline in Bacteroidetes during the broccoli intervention was positively correlated with the maximum peak in plasma metabolites (r=0.69, P=0.04), Table 3. The change from baseline in Firmicutes tended to be negatively correlated with the maximum peak in plasma metabolites (r=−0.66, P=0.05) and the change in Bacteridetes to Firmicutes ratio tended to be positively correlated (r=0.58, P=0.1). During the control period, there were no significant associations, but the change in Bacteroidetes to Firmiutes ratio tended to be negatively correlated with urine metabolites (r=−0.59, P=0.09).
Table 3:
Results of bivariate correlations between bacterial relative abundances and glucosinolate metabolites within the lower (< 26 kg/m2) BMI group.
| Control | Broccoli | ||||||
|---|---|---|---|---|---|---|---|
| Urine | Mmax | AUC | Urine | Mmax | AUC | ||
| Bacteroidetes | r=−0.57 | r=−0.44 | r=−0.50 | Bacteroidetes | r=0.25 | r=0.69 | r=0.46 |
| P=0.11 | P=0.24 | P=0.17 | P=0.51 | P=0.04 | P=0.22 | ||
| Firmicutes | r=0.36 | r=0.24 | r=0.34 | Firmicutes | r=−0.11 | r=−0.66 | r=−0.33 |
| P=0.34 | P=0.54 | P=0.37 | P=0.77 | P=0.05 | P=0.38 | ||
| B/F Ratio | r=−0.59 | r=−0.32 | r=−0.46 | B/F Ratio | r=0.26 | r=0.58 | r=0.22 |
| P=0.09 | P=0.40 | P=0.22 | P=0.50 | P=0.10 | P=0.56 | ||
| Bacteroides | r=−0.49 | r=−0.34 | r=−0.33 | Bacteroides | r=0.14 | r=0.55 | r=0.34 |
| P=0.18 | P=0.37 | P=0.38 | P=0.72 | P=0.12 | P=0.36 | ||
| B. thetaiotomicron | r=0.28 | r=−0.21 | r=−0.01 | B. thetaiotomicron | r=−0.10 | r=−0.45 | r=−0.41 |
| P=0.50 | P=0.61 | P=0.99 | P=0.83 | P=0.31 | P=0.36 | ||
| B. vulgatus | r=−0.13 | r=−0.41 | r=−0.20 | B. vulgatus | r=0.24 | r=−0.10 | r=−0.18 |
| P=0.75 | P=0.32 | P=0.64 | P=0.57 | P=0.81 | P=0.67 | ||
“Urine” indicates total metabolites accumulated in urine over 24 hours. “Mmax” indicates the maximum peak of metabolites in plasma. “AUC” indicates area under the curve for plasma metabolites. N=9 for all statistics at the genus level or above. N=8 for B. vulgatus during both periods and B. thetaiotaomicron during the control period. N=7 for B. thetaiotaomicron during the broccoli period. Further detail on metabolites published elsewhere [13].
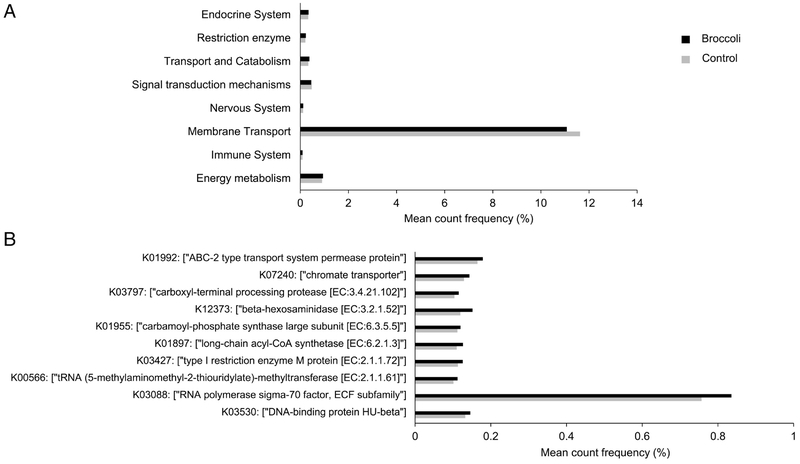
We also analyzed the functional potential of the gut microbiome by the end of the feeding trial using PICRUSt (Figure 8). Overall, broccoli consumption increased the pathways involved in the functions of the endocrine system (P=0.05), transport and catabolism (P=0.04), and energy metabolism (P=0.01) and decreased the pathways involved in membrane transport (P=0.03). Further, the predicted protein families enriched in the broccoli group include those involved in cellular transportation and transcription regulation (e.g., RNA polymerase sigma-70 factor).
Figure 8:
(A) Functional prediction and (B) top 10 most abundant protein families of the gastrointestinal microbiota at the end of the feeding trial. Predicted by PICRUSt according to the KEGG orthology (KO). One-way ANOVA with post-hoc Tukey test indicated P<0.05 for all comparisions shown. n=18 per group.
4. Discussion
With the growing body of evidence that diet impacts the human gastrointestinal microbiota, and that the microbiota is associated with health, controlled feeding studies that isolate specific foods to identify their effects on the microbiota are needed. Studies of this kind narrow the focus from overall eating patterns to discrete changes that may modulate the microbiota in specific ways to achieve desired outcomes. Cruciferous vegetables are high on the list of importance because of the potential for the microbiota to mediate their biological activity via microbial myrosinase. Herein, we report that consumption of 200 g per day of cooked broccoli as part of a completely controlled feeding study in healthy adults impacted the community structure of the gastrointestinal microbiota with the greatest changes in the relative abundances of bacteria in the Bacteroidetes phylum.
In this study, there were no changes in alpha diversity as a result of broccoli consumption. This indicates that no bacterial species were extinguished by broccoli treatment, which may be beneficial because of associations between reduced alpha diversity and disease [23,24]. The results revealed a change in beta diversity, indicating that broccoli treatment impacted the microbial community. The change in beta diversity was primarily related to the positive change in the Bacteroidetes to Firmicutes ratio. Interestingly, a higher value of this ratio has been associated with leanness in both preclinical and clinical studies; however, a recent systematic review has revealed this relationship is not always consistent [25]. However, as this study was designed to ensure that participants maintained their weight throughout the study, we were not able to assess connections between body weight changes and the microbiota in the present study. Interestingly, the results we report here and elsewhere are driven by participants with lower BMI [13].
Furthermore, we report preliminary analyses indicating that plasma and urine glucosinolate metabolites may be related to changes in the human gastrointestinal microbiota in participants with a BMI < 26 kg/m2. This likewise corresponds with the findings published previously that participants with a BMI < 26 kg/m2 showed an expected increase in metabolites following daily broccoli consumption, while those with BMI > 26 kg/m2 did not [13]. These results lend support to the hypothesis that changes in the microbiota may be related to changes in the availability of health-promoting glucosinolate metabolites.
Recently, a study reported changes in the human gastrointestinal microbiota following the addition of broccoli, cauliflower, and broccoli/sweet potato soup to participants’ normal diets at low (252 g brassica vegetables/week) and high (756 g brassica vegetables/week) doses for two-week periods. Similar to the findings reported herein, Kellingray et al. reported that nine bacterial taxa, of which all but two are members of the Firmicutes phylum, decreased following the brassica vegetable treatment. While we did not detect changes at the genus level, the relative abundance of the Firmicutes phylum was reduced by 8% following the broccoli consumption period. Kellingray et al. also report a decrease in sulfate-reducing bacteria, such as Bilophila and Desulfovibrio. These bacteria were detectable in our sample, but they were not affected by broccoli treatment. The differences in study design and treatment dosages between the Kellingray et al. report and ours likely contributed to the difference in results. Indeed, our study utilized a complete feeding design with a higher treatment dosage (1400 g/week) of broccoli rather than a mixture of cruciferous vegetables. In addition, although their sequencing and data analysis methods were similar to ours, there was a difference in the 16S rRNA primers on the Illumina MiSeq platform, which could influence results [26].
Our results indicated that the relative abundance of the Bacteroides genus increased with broccoli consumption compared to control. We pursued further at the species level to examine if the abundance of B. thetaiotaomicron and B. vulgatus changed following the broccoli diet. Although B. thetaiotaomicron and B. vulgatus have been shown to hydrolyze glucosinolates in gnotobiotic rats [18,19], our study showed no significant changes in the abundances of B. thetaiotaomicron and B. vulgatus among healthy adults. This may be due to the fact that not all strains of these bacteria hydrolyze glucosinolates and the slight change in abundance of the minor members that possess this enzymatic activity in response to broccoli consumption was not detectable by our assay. Additionally, the Bacteroides genus may be important to the overall ecological stability of the microbiota because of the breadth of metabolic capacity which allows Bacteroides to provide substrates for cross-feeding taxa with a more narrow metabolic range [27]. Furthermore, our intervention likely dosed the microbiota with both glucosinolates and isothiocyanates, due to the action of plant myrosinase from the daikon radish. The plant myrosinase action is thought to be effective yet incomplete. Most glucosinolate metabolites in this study peaked in plasma 1–3 hours after broccoli consumption, which would be prior to standard transit time to the colon. This result indicates that a substantial portion of the glucosinolates were hydrolyzed by myrosinase from the daikon radish. However, sulforaphane peaked after approximately 5 hours, indicating further conversion took place once the bolus reached the distal small intestine and colon. This intervention was designed to mimic the consumption of raw broccoli, and as would be the case had raw broccoli been utilized, it presents the difficulty of assessing what proportion of glucosinolates were available for microbial cleavage and potentially impact glucosinolate-metabolizing bacterial taxa.
Whereas we did not detect differences at the species level in B. vulgatus and B. thetaiotaomicron, these species represent only two of the species that could be affected by broccoli consumption. For example, in vitro studies have shown that Lactobacillus agilis, Escherichia coli, and Bifidobacterium spp., can metabolize glucosinolates [28,29]. Unfortunately, the gene sequence for very few bacterial myrosinases has been discovered and no conserved sequence unique to these enzymes has been identified. Therefore, it precludes the use of qPCR to quantify total copy number of the bacterial myrosinase gene within the microbiota. To overcome this, future studies should also assess the myrosinase activity in fecal samples by in vitro assays employing analysis of metabolites via HPLC or mass spectrometry. Including this functional analysis could reveal the altered metabolic activity of the gastrointestinal microbiota due to the consumption of dietary broccoli, as has been seen in rodent models [11].
As broccoli is a whole food, the microbial changes in response to its consumption may be related to many different factors including fiber and glucosinolates. In a rodent model, dietary glucoraphanin (the main glucosinolate found in broccoli) was specifically responsible for the increased ability of the gut microbiome to hydrolyze glucoraphanin, whereas changes in the cecal microbial communities were attributed to other broccoli components [11]. The broccoli used in this study contained an average of 5 g of fiber per 200 g of broccoli, of which 3.5 g was insoluble. Fiber is a preferred substrate for bacterial metabolism [5], and fibers of varying solubility have different impacts on the gastrointestinal microbiota community structure and colonic barrier integrity [30]. Therefore, it is possible that the addition of 5 g of fiber from the broccoli is also contributing to the changes observed in the present study since Bacteroides were enhanced by a broccoli fiber diet in rats [31].
Whole food feeding studies of broccoli have been performed in both preclinical and clinical models. In a murine model, decreases in Faecalibacterium prausnitzii, Clostridium perfringens, Enterococcus, Lactobacillus, and Escherichia coli were observed following broccoli consumption [32]. Although these findings might be unexpected considering the association of three of these genera with glucosinolate metabolism in vitro, we acknowledge that consumption of raw cruciferous vegetables presents the microbiota with a host of other compounds, including isothiocyanates resulting from the cleavage of glucosinolates by plant myrosinase, which could potentially affect the microbial ecological structure. We also observed in a previous study that the abundance of the genus Clostridium decreased following >4 days of the consumption of broccoli in a rat model, while glucosinolate hydrolytic activity by the microbiota increased ex vivo [11]. Work by Li et al. in humans reported increases in bacteria including Eubacterium, Phascolarctobacterium, Alistipes, and Eggerthella [33], whereas other work by this group was unable to detect differences in bacterial community structure between high- and low-ITC excreters [34]. However, the previous clinical studies differed from the current study in regards to treatment dose and methodological approaches, which may have contributed to the differences in outcomes. Specifically, the treatment dose of broccoli was greater in the study by Li et al. than the current study (1 kg/d, vs. 200 g/day, respectively), and our sample size was larger than the study undertaken by Li et al. (n=18 vs. n=5, respectively). Furthermore, being more recent, we utilized the most current sequencing and bioinformatics technologies available to characterize changes in both the microbiota composition and its functional capacity.
A limitation of this study is the use of a predictive algorithm to characterize the function of the gastrointestinal microbiota. The predictive tool, PICRUSt, has been frequently used to predict the metabolic potential of microbiota following dietary interventions such as fibers and walnuts [35,36]. PICRUSt infers the metabolic activities of the microbiota by comparing the composition (diversity and abundance of OTUs) with reference genomes of known functional potential [37]. We reported that broccoli consumption altered the mean count frequency (%) of sequences assigned to various KEGG Orthologs (KOs) and increased functions involving the endocrine system, transport and catabolism, and energy metabolism (Figure 8). However, findings of such functional change, while novel, require experimental confirmation by whole genome shotgun sequencing and metabolite profiling.
Despite this limitation, a complete feeding, crossover, randomized clinical trial is the strongest possible design for studying the impact of consumption of a specific food on the human gastrointestinal microbiota. Additionally, the intervention employed herein was a commercially available whole vegetable that was prepared in a way and served at a dose that would be typical of an average American. In conclusion, this study adds to that body of evidence by demonstrating that broccoli consumption impacts the microbiota, highlighting the potential for dietary intervention to benefit health via microbiota modulation.
Supplementary Material
Highlights.
Broccoli shifts beta diversity of the human microbiota.
Broccoli increased Bacteroidetes and decreased Firmicutes.
Broccoli consumption increased abundance of Bacteroides.
B. vulgatus and B. thetciiotciomicron show no change by treatment.
Acknowledgments
The authors thank Patrick Degnan for the donation of bacterial cultures.
Funding: This work was supported by the United States Department of Agriculture, Agricultural Research Service [Grant numbers USDA 58-8040-6-010 and 8040-51000-056-00D]; National Cancer Institute [Grant number ACN16003]; University of Illinois Division of Nutritional Sciences Research Excellence Fellowship; University of Illinois Margin of Excellence Research Award.
Footnotes
Publisher's Disclaimer: This is a PDF file of an unedited manuscript that has been accepted for publication. As a service to our customers we are providing this early version of the manuscript. The manuscript will undergo copyediting, typesetting, and review of the resulting proof before it is published in its final citable form. Please note that during the production process errors may be discovered which could affect the content, and all legal disclaimers that apply to the journal pertain.
Declarations of interest: none
Conflict of interest: The authors declare no conflict of interest.
References
- [1].Sonnenburg JL, Bäckhed F. Diet–microbiota interactions as moderators of human metabolism. Nature 2016;535:56–64. doi: 10.1038/nature18846. [DOI] [PMC free article] [PubMed] [Google Scholar]
- [2].Wu GD, Chen J, Hoffmann C, Bittinger K, Chen Y-Y, Keilbaugh SA, et al. Linking long-term dietary patterns with gut microbial enterotypes. Science (80- ) 2011. ;334:105–8. doi: 10.1126/science.1208344. [DOI] [PMC free article] [PubMed] [Google Scholar]
- [3].David LA, Maurice CF, Carmody RN, Gootenberg DB, Button JE, Wolfe BE, et al. Diet rapidly and reproducibly alters the human gut microbiome. Nature 2014;505:559–63. doi: 10.1038/nature12820. [DOI] [PMC free article] [PubMed] [Google Scholar]
- [4].Kaczmarek JL, Musaad SM, Holscher HD. Time of day and eating behaviors are associated with the composition and function of the human gastrointestinal microbiota. Am J Clin Nutr 2017; 106:1220–31. doi: 10.3945/ajcn.117.156380. [DOI] [PubMed] [Google Scholar]
- [5].Holscher HD. Dietary fiber, prebiotics, and the gastrointestinal microbiota. Gut Microbes 2017;8:172–84. doi: 10.1080/19490976.2017.1290756. [DOI] [PMC free article] [PubMed] [Google Scholar]
- [6].Holscher HD, Guetterman HM, Swanson KS, An R, Matthan NR, Lichtenstein AH, et al. Walnut consumption alters the gastrointestinal microbiota , microbial-derived secondary bile acids , and health markers in healthy adults : a randomized controlled trial. J Nutr 2018. [DOI] [PMC free article] [PubMed] [Google Scholar]
- [7].Holscher HD, Taylor AM, Swanson KS, Novotny JA, Baer DJ. Almond consumption and processing affects the composition of the gastrointestinal microbiota of healthy adult men and women: a randomized controlled trial. Nutrients 2018;10:126. doi: 10.3390/nu10020126. [DOI] [PMC free article] [PubMed] [Google Scholar]
- [8].Fahey JW, Zalcmann AT, Talalay P. The chemical diversity and distribution of glucosinolates and isothiocyanates among plants. Phytochemistry 2001;56:5–51. doi: 10.1016/S0031-9422(00)00316-2. [DOI] [PubMed] [Google Scholar]
- [9].Angelino D, Dosz EB, Sun J, Hoeflinger JL, Van Tassell ML, Chen P, et al. Myrosinase-dependent and -independent formation and control of isothiocyanate products of glucosinolate hydrolysis. Front Plant Sci 2015;6:831. doi: 10.3389/fp1s.2015.00831. [DOI] [PMC free article] [PubMed] [Google Scholar]
- [10].Bauman JE, Zang Y, Sen M, Li C, Wang L, Egner PA, et al. Prevention of carcinogen-induced oral cancer by sulforaphane. Cancer Prev Res (Phila) 2016;9:547–57. doi: 10.1158/1940-6207.CAPR-15-0290. [DOI] [PMC free article] [PubMed] [Google Scholar]
- [11].Liu X, Wang Y, Hoeflinger J, Neme B, Jeffery E, Miller M. Dietary broccoli alters rat cecal microbiota to improve glucoraphanin hydrolysis to bioactive isothiocyanates. Nutrients 2017;9:262. doi: 10.3390/nu9030262. [DOI] [PMC free article] [PubMed] [Google Scholar]
- [12].Dietary Guidelines Advisory Committee. Scientific Report of the 2015 Dietary Guidelines Advisory Committee. 2015.
- [13].Charron C, Vinyard B, Ross S, Seifried H, Jeffery E, Novotny Dura J. Absorption and metabolism of isothiocyanates formed from broccoli glucosinolates: effects of BMI and daily consumption in a randomised clinical trial. Br J Nutr 2018:In Press. [DOI] [PubMed] [Google Scholar]
- [14].Venable EB, Fenton KA, Braner VM, Reddington CE, Halpin MJ, Heitz SA, et al. Effects of feeding management on the equine cecal microbiota. J Equine Vet Sci 2017;49:113–21. doi: 10.1016/j.jevs.2016.09.010. [DOI] [Google Scholar]
- [15].Caporaso JG, Kuczynski J, Stombaugh J, Bittinger K, Bushman FD, Costello EK, et al. QIIME allows analysis of high-throughput community sequencing data. Nat Methods 2010;7:335–6. doi: 10.1038/nmeth.f.303. [DOI] [PMC free article] [PubMed] [Google Scholar]
- [16].Bokulich NA, Subramanian S, Faith JJ, Gevers D, Gordon JI, Knight R, et al. Quality-filtering vastly improves diversity estimates from Illumina amplicon sequencing. Nat Methods 2012;10:57–9. doi: 10.1038/nmeth.2276. [DOI] [PMC free article] [PubMed] [Google Scholar]
- [17].Lozupone C, Lladser ME, Knights D, Stombaugh J, Knight R. UniFrac: an effective distance metric for microbial community comparison. ISME J 2011;5:169–72. doi: 10.1038/ismej.2010.133. [DOI] [PMC free article] [PubMed] [Google Scholar]
- [18].Elfoul L, Rabot S, Khelifa N, Quinsac A, Duguay A, Rimbault A. Formation of allyl isothiocyanate from sinigrin in the digestive tract of rats monoassociated with a human colonic strain of Bacteroides thetaiotaomicron. FEMS Microbiol Lett 2001; 197. doi: 10.1111/j.l574-6968.2001.tbl0589.x. [DOI] [PubMed] [Google Scholar]
- [19].Rabot S, Nugon-Baudon L, Raibaud P, Szylit O. Rape-seed meal toxicity in gnotobiotic rats: influence of a whole human faecal flora or single human strains of Escherichia coli and Bacteroides vulgatus. Br J Nutr 1993;70:323–31. doi: 10.1079/BJN19930125. [DOI] [PubMed] [Google Scholar]
- [20].Wang RF, Cao WW, Cerniglia CE. PCR detection and quantitation of predominant anaerobic bacteria in human and animal fecal samples. Appl Environ Microbiol 1996;62:1242–7. [DOI] [PMC free article] [PubMed] [Google Scholar]
- [21].Wu X, Ma C, Han L, Nawaz M, Gao F, Zhang X, et al. Molecular characterisation of the faecal microbiota in patients with Type II Diabetes. Curr Microbiol 2010;61:69–78. doi: 10.1007/s00284-010-9582-9. [DOI] [PubMed] [Google Scholar]
- [22].Parks DH, Tyson GW, Hugenholtz P, Beiko RG. STAMP: statistical analysis of taxonomic and functional profiles. Bioinformatics 2014;30:3123–4. doi: 10.1093/bioinformatics/btu494. [DOI] [PMC free article] [PubMed] [Google Scholar]
- [23].Turnbaugh PJ, Hamady M, Yatsunenko T, Cantarel BL, Duncan A, Ley RE, et al. A core gut microbiome in obese and lean twins. Nature 2009;457:480–4. doi: 10.1038/nature07540. [DOI] [PMC free article] [PubMed] [Google Scholar]
- [24].De Vos WM, De Vos EA. Role of the intestinal microbiome in health and disease: from correlation to causation. Nutr Rev 2012;70:S45–56. doi: 10.1111/j.1753-4887.2012.00505.x. [DOI] [PubMed] [Google Scholar]
- [25].Sze MA, Schloss PD. Looking for a signal in the noise: revisiting obesity and the microbiome. MBio 2016;7:e01018–16. doi: 10.1128/mBio.01018-16. [DOI] [PMC free article] [PubMed] [Google Scholar]
- [26].Tremblay J, Singh K, Fern A, Kirton ES, He S, Woyke T, et al. Primer and platform effects on 16S rRNAtag sequencing. Front Microbiol 2015;6:771. doi: 10.3389/fmicb.2015.00771. [DOI] [PMC free article] [PubMed] [Google Scholar]
- [27].Payne AN, Chassard C, Lacroix C. Gut microbial adaptation to dietary consumption of fructose, artificial sweeteners and sugar alcohols: implications for host-microbe interactions contributing to obesity. Obes Rev 2012;13:799–809. doi: 10.1111/j.1467-789X.2012.01009.X. [DOI] [PubMed] [Google Scholar]
- [28].Luang-In V, Narbad A, Cebeci F, Bennett M, Rossiter JT. Identification of proteins possibly involved in glucosinolate metabolism in L. agilis R16 and E. coli VL8. Protein J 2015;34:135–46. doi: 10.1007/sl0930-015-9607-0. [DOI] [PubMed] [Google Scholar]
- [29].Cheng D-L, Hashimoto K, Uda Y. In vitro digestion of sinigrin and glucotropaeolin by single strains of Bifidobacterium and identification of the digestive products. Food Chem Toxicol 2004;42:351–7. doi: 10.1016/j.fct.2003.09.008. [DOI] [PubMed] [Google Scholar]
- [30].Liu T-W, Cephas KD, Holscher HD, Kerr KR, Mangian HF, Tappenden KA, et al. Nondigestible fructans alter gastrointestinal barrier function, gene expression, histomorphology, and the microbiota profiles of diet-induced obese C57BL/6J mice. J Nutr 2016;146:949–56. doi: 10.3945/jn.115.227504. [DOI] [PubMed] [Google Scholar]
- [31].Paturi G, Butts CA, Stoklosinski H, Herath TD, Monro JA. Short-term feeding of fermentable dietary fibres influences the gut microbiota composition and metabolic activity in rats. Int J Food Sci Technol 2017;52:2572–81. doi: 10.1111/ijfs.13543. [DOI] [Google Scholar]
- [32].Paturi G, Mandimika T, Butts CA, Zhu S, Roy NC, McNabb WC, et al. Influence of dietary blueberry and broccoli on cecal microbiota activity and colon morphology in mdrla−/− mice, a model of inflammatory bowel diseases. Nutrition 2012;28:324–30. doi: 10.1016/j.nut.2011.07.018. [DOI] [PubMed] [Google Scholar]
- [33].Li F, Hullar MAJ, Schwarz Y, Lampe JW. Human gut bacterial communities are altered by addition of cruciferous vegetables to a controlled fruit- and vegetable-free diet. J Nutr 2009;139:1685–91. doi: 10.3945/jn.109.108191. [DOI] [PMC free article] [PubMed] [Google Scholar]
- [34].Li F, Hullar MAJ, Beresford SAA, Lampe JW. Variation of glucoraphanin metabolism in vivo and ex vivo by human gut bacteria. Br J Nutr 2011;106:408–16. doi: 10.1017/S0007114511000274. [DOI] [PMC free article] [PubMed] [Google Scholar]
- [35].Bishehsari F, Engen P, Preite N, Tuncil Y, Naqib A, Shaikh M, et al. Dietary fiber treatment corrects the composition of gut microbiota, promotes SCFA production, and suppresses colon carcinogenesis. Genes (Basel) 2018;9:102. doi: 10.3390/genes9020102. [DOI] [PMC free article] [PubMed] [Google Scholar]
- [36].Byerley LO, Samuelson D, Blanchard E, Luo M, Lorenzen BN, Banks S, et al. Changes in the gut microbial communities following addition of walnuts to the diet. J Nutr Biochem 2017;48:94–102. doi: 10.1016/J.JNUTBI0.2017.07.001. [DOI] [PMC free article] [PubMed] [Google Scholar]
- [37].Langille MGI, Zaneveld J, Caporaso JG, McDonald D, Knights D, Reyes JA, et al. Predictive functional profiling of microbial communities using 16S rRNA marker gene sequences. Nat Biotechnol 2013;31:814–21. doi: 10.1038/nbt.2676. [DOI] [PMC free article] [PubMed] [Google Scholar]
Associated Data
This section collects any data citations, data availability statements, or supplementary materials included in this article.


