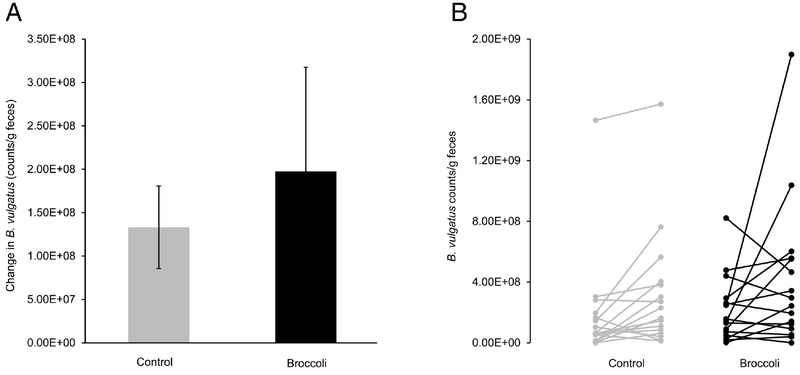
Figure 6:
A) Change in Bacteroides vulgatus counts/g feces, as measured by quantitative PCR, from baseline to end within each treatment period. (Mean ± SD; n=18 per group.) B) Change within individual subjects of Bacteroides vulgatus counts/g feces, as measured by quantitative PCR, from baseline to end within each treatment period; each line connects one subject’s baseline reading (on the left) to their own end value (on the right). n=18 per group.

