Figure 4.
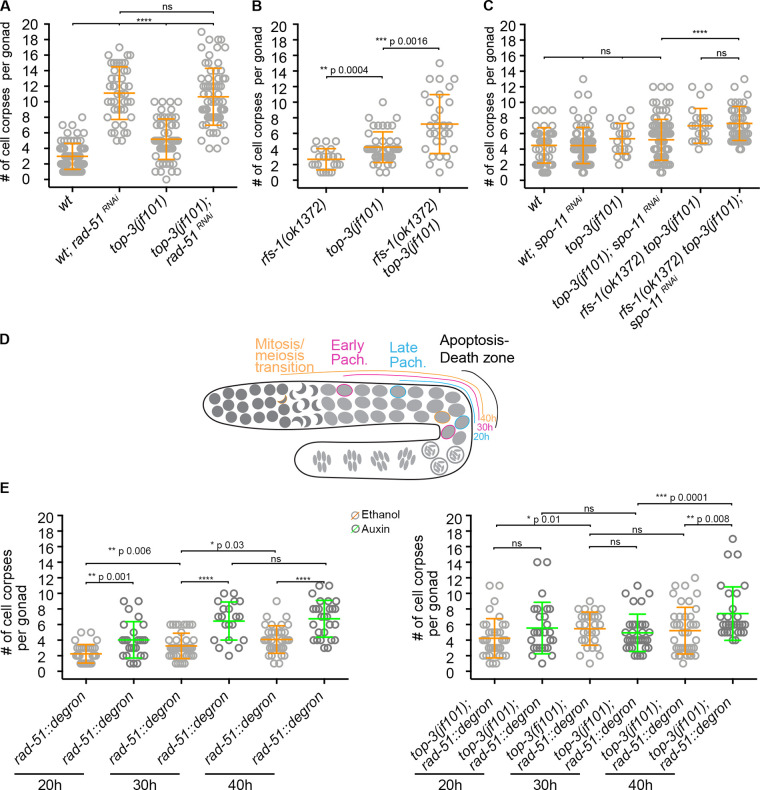
RAD-51 depletion in premeiotic nuclei triggers DNA damage apoptosis in the top-3 mutant. (A–C) Apoptosis quantification using SYTO-12 in the indicated genotypes. Scatter plots indicate the mean ± SD; n = number of gonads scored. (A) wt and top-3(jf101) subjected to rad-51RNAi: wt, 3 ± 1.7, n = 76; wt; rad-51RNAi, 11.1 ± 3.4, n = 44; top-3(jf101), 5.2 ± 2.6, n = 54; and top-3(jf101); rad-51RNAi, 10.65 ± 3.7, n = 68. ****, P < 0.0001, ns , calculated using the Mann–Whitney test. (B) rfs-1(ok1372),2.7 ± 1.4, n = 22; top-3(jf101) (quantification as described in Fig. 2 D), 4.2 ± 1.9, n = 43; and rfs-1(ok1372) top-3(jf101), 7.2 ± 3.8, n = 30. P values were calculated using the Mann–Whitney test. (C) wt, 4.5 ± 2.3, n = 41; wt; spo-11RNAi, 4.5 ± 2.3, n = 78; top-3(jf101), 5.3 ± 1.9, n = 20; top-3(jf101); spo-11RNAi, 5.2 ± 2.6, n = 89; rfs-1(ok1372) top-3(jf101),7 ± 2.2, n = 24; and rfs-1(ok1372) top-3(jf101); and spo-11RNAi, 7.3 ± 2.2, n = 44. ****, P < 0.0001, ns, calculated using the Mann–Whitney test. (D) Schematic representation of RAD-51 depletion in the C. elegans germline. The indicated number of hours of exposure to auxin or solvent (ethanol) corresponds to the periods of exposure during prophase before apoptosis in pachynema (death zone; e.g., exposed for 20 h means that the nuclei were in mid-pachynema when RAD-51 was depleted; also see Fig. S3 A for RAD-51 depletion upon auxin treatment). Pach., pachynema. (E) Time-course analysis of the rad-51::degron control (left) and top-3(jf101); rad-51::degron (right); apoptosis was quantified with SYTO-12 in the absence (orange) or presence (green) of auxin. n = number of gonads scored. rad-51::degron (ethanol: 20 hours (h), 2.3 ± 1.2, n = 32; 30 h, 3.3 ± 1.6, n = 41; 40 h, 4.1 ± 1.8, n = 35; auxin: 20 h, 4 ± 2.3, n = 25; 30 h, 6.5 ± 2.4, n = 20; 40 h, 6.7 ± 2.4, n = 27); top-3(jf101); and rad-51::degron (ethanol: 20 h, 4.2 ± 2.5, n = 37; 30 h, 5.5 ± 2.1, n = 28; 40 h, 5.2 ± 3, n = 40; auxin: 20 h, 5.6 ± 3.3, n = 27; 30 h, 4.9 ± 2.4, n = 34; 40 h, 7.4 ± 3.5, n = 29). Error bars indicate the mean (and SD), ****, P < 0.0001; ns, calculated using the Mann–Whitney test.

