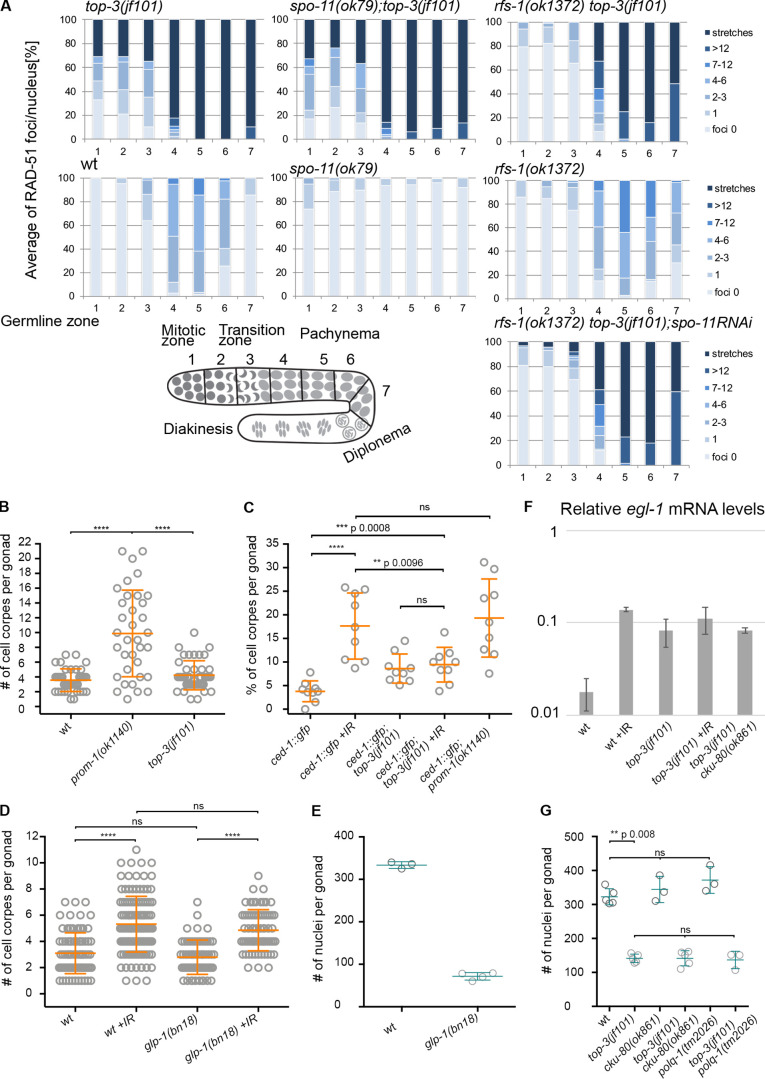
Figure S2.
top-3(jf101) DNA lesions do not trigger a proper apoptotic response. Related to Figs. 1, 2, and 3. (A) The percentage of RAD-51 foci per nucleus in each of the seven zones in the indicated genotypes. For each zone, the average number of RAD-51 foci/nucleus was calculated from three gonads/genotype. Bottom left: Schematic representation of the C. elegans gonad divided into seven equal zones. (B) Apoptosis quantification with SYTO-12. Apoptotic levels in the top-3 mutant were compared with those in the prom-1 mutant, which has elevated DNA damage–induced apoptosis. wt and top-3 have similar levels of apoptosis (shown in Fig. 2 D), but levels are significantly different in prom-1 (9.9 ± 5.9, n = 35 scored gonads) and top-3(jf101). ****, P < 0.0001, calculated using the Mann–Whitney test. (C) Scatter plot displaying the percentage of apoptotic nuclei assessed by CED-1::GFP staining, normalized to the total number of nuclei in the last 10 cell rows of the gonad in the indicated genotypes. Nine gonads were analyzed per genotype. Error bars indicate the mean ± SD per genotype: ced-1::gfp, 3.8 ± 2.2; ced-1::gfp +IR, 17.6 ± 7; ced-1::gfp; top-3(jf101), 8.6 ± 3; ced-1::gfp; top-3(jf101) +IR, 9.4 ± 3.7; and ced-1::gfp; prom-1(ok1140), 19.3 ± 8.3. ****, P < 0.0001, calculated using the Mann–Whitney test. (D) Apoptosis quantification with SYTO-12 of glp-1 mutants with and without irradiation compared with wt. glp-1 is a temperature-sensitive allele: the worms are grown at 16°C and shifted to 25°C at the L4 stage. Experiments on glp-1 were performed at 25°C and 7 h after irradiation. Scatter plots indicate the mean ± SD; number of apoptotic nuclei for each genotype: wt, 3.1 ± 1.6, n = 82; wt +IR, 5.3 ± 2.1, n = 122; glp-1(bn18), 2.8 ± 1.3, n = 63; and glp-1(bn18) +IR, 4.9 ± 1.6, n = 70. n = number of scored gonads. ****, P < 0.0001, calculated using the Mann–Whitney test. (E) Quantification of the total number of germline nuclei from the mitotic region to late pachynema. Scatter plots indicate the mean ± SD. Three gonads per genotype were analyzed: wt, 333.7 ± 7.8; and glp-1(bn18), 71.75 ± 8.8. (F) Relative egl-1 mRNA levels, as quantified by RT-qPCR, in wt, top-3(jf101), and top-3(jf101) cku-80(ok861) after irradiation and unirradiated. Numbers correspond to the average of at least three independent RNA extractions and RT-qPCR reactions. Error bars indicate the SD. (G) Quantification of the total number of germline nuclei from the mitotic region to late pachynema. Scatter plots indicate the mean ± SD. Three to five gonads were quantified for each genotype. wt and top-3(jf101) are identical to Fig. 1 D; wt, 322.8 ± 23.7; top-3(jf101), 141.4 ± 12.5; cku-80(ok861), 344.3 ± 38.5; top-3(jf101) cku-80(ok861), 141.6 ± 22.2; polq-1(tm2026), 372 ± 39.4; top-3(jf101) polq-1(tm2026), 136.7 ± 25.7. P values calculated using the Mann–Whitney test. wt, wild-type.

