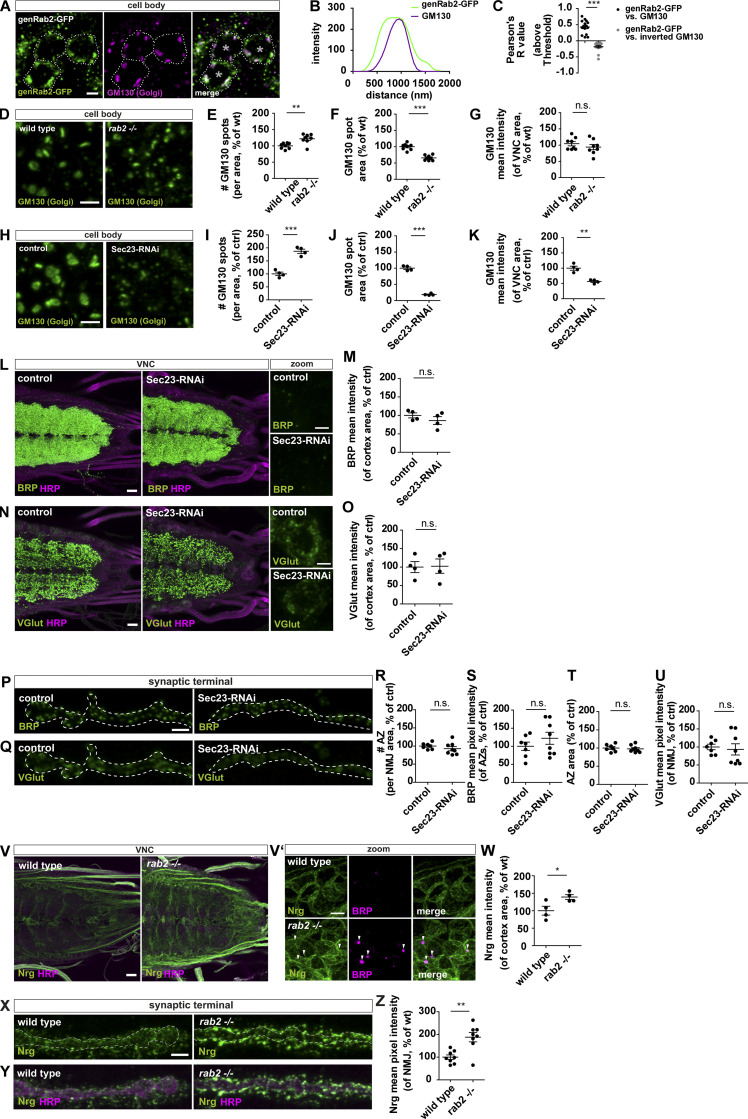
Figure 4.
Disruption of the Golgi is not generically affecting precursor biogenesis. (A) Confocal images of neuronal cell bodies (outlined by dashed line; *, nucleus) expressing genomic Rab2-GFP stained for genRab2 (green) and GM130 (magenta). (B) Corresponding line profiles with the transparent line indicating site of extraction. (C) Pearson’s correlation coefficient (genRab2-GFP versus GM130: 0.43 ± 0.05, n = 15; inverted GM130: −0.19 ± 0.04, n = 15). (D–Q) Confocal images of neuronal somata of wild-type and rab2−/− mutant (D) and control and Sec23-RNAi–expressing larvae labeled for GM130 (H; green). Number of GM130-labeled spots per VNC area for rab2−/− mutant (E; wild-type: 100 ± 3.10%, n = 8; rab2−/−: 121.9 ± 5.37%, n = 8), and Sec23-RNAi larvae (I; control: 100 ± 6.57%, n = 4; Sec23-RNAi: 186.9 ± 8.07%, n = 4). GM130-labeled spot area (F; wild-type: 100 ± 3.52%, n = 8; rab2−/−: 65.77 ± 2.84%, n = 8), and Sec23-RNAi larvae (J; control: 100 ± 3.85%, n = 4; Sec23-RNAi: 18.81 ± 1.43%, n = 4). Mean pixel intensity of GM130 signal within the analyzed VNC area for rab2−/− mutant (G; wild-type: 104.4 ± 6.64%, n = 8; rab2−/−: 93.76 ± 7.93%, n = 8), and Sec23-RNAi larvae (K; control: 100 ± 6.61%, n = 4; Sec23-RNAi: 56.59 ± 3.17%, n = 4). Confocal images of larval VNCs from control and Sec23-RNAi larvae labeled for BRP (L; green) or VGlut (N; green) and HRP (magenta). Mean pixel intensity for BRP (M; control: 100 ± 6.61%, n = 4; Sec23-RNAi: 86.04 ± 10.46%, n = 4) and VGlut (O; control: 100 ± 14.88%, n = 4; Sec23-RNAi: 102.4 ± 19.42%, n = 4). Confocal images of control and Sec23-RNAi NMJs stained for BRP (P; green) or VGlut (Q; green). (R) Number of AZs per NMJ area (control: 100 ± 3.21%, n = 7; Sec23-RNAi: 92.71 ± 5.85%, n = 8). (S) BRP mean pixel intensity of individual AZs (control: 100 ± 11.45%, n = 7; Sec23-RNAi: 122.0 ± 16.70%, n = 8). (T) AZ area (control: 100 ± 3.79%, n = 7; Sec23-RNAi: 97.50 ± 3.46%, n = 8). (U) VGlut mean pixel intensity (control: 100 ± 7.44%, n = 7; Sec23-RNAi: 93.17 ± 15.55%, n = 8). (V and V′) Confocal images of wild-type and rab2−/− mutant VNCs stained for Nrg (green) and HRP (magenta) or BRP (V′; magenta). Arrowheads point to ectopic BRP aggregates. (W) Nrg mean pixel intensity (control: 100 ± 12.62%, n = 4; rab2−/−: 139.1 ± 6.85%, n = 4). (X and Y) Confocal images of wild-type and rab2−/− mutant NMJs stained for Nrg (green) and HRP (magenta). (Z) Nrg mean pixel intensity (control: 100 ± 9.77%, n = 4; rab2−/−: 188.0 ± 20.63%, n = 4). Scale bars: VNC zooms (A, D, H, L, N, and V′), 2 µm; VNC overviews (L, N, and V), 10 µm; and NMJs (P, Q, X, and Y), 3 µm. All data provided as mean ± SEM. n represents single evaluated coaggregates from three VNCs (C), single VNCs (E–G, I–K, M, O, and W), or single NMJs (R–U, Z) with one or two NMJs/animal. *, P < 0.05; **, P < 0.01; ***, P < 0.001. ctrl, control; genRab2, genomic Rab2; wt, wild-type.

