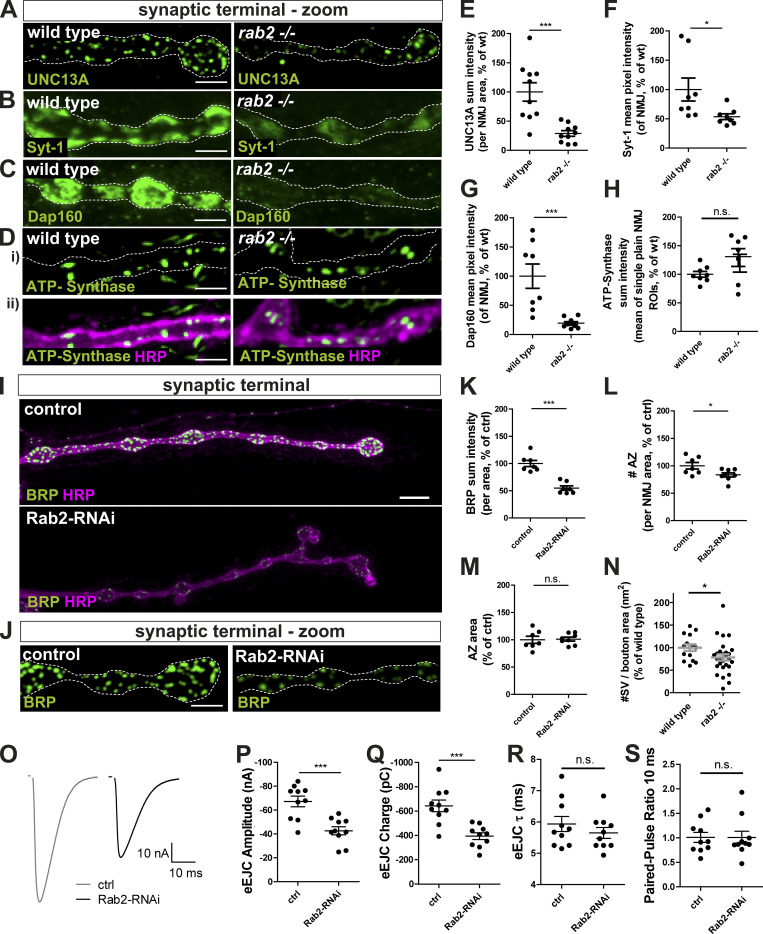
Figure S4.
Presynaptic biogenesis relies on the Rab2 dependent delivery of presynaptic material. (A–H) Confocal images of wild-type and rab2−/− mutant NMJs stained in green for UNC13A (A), Syt-1 (B), Dap160 (C), ATP-synthase (D; green), and HRP (magenta, as a neuronal membrane marker). Scale bar, 3 µm. Corresponding quantification of the protein sum (or mean pixel) intensity for UNC13A (E: wild-type: 100.0 ± 15.83%, n = 10; rab2−/−: 28.96 ± 4.821%, n = 10), Syt-1 (F; wild-type: 100.0 ± 19.60%, n = 8; rab2−/−: 53.57 ± 4.89%, n = 8), Dap160 (G; wild-type: 100.0 ± 20.83%, n = 8; rab2−/−: 19.35 ± 2.592%, n = 10), and ATP-synthase (H; wild-type: 100.0 ± 5.060%, n = 8; rab2−/−: 129.4 ± 15.54%, n = 7). (I) Confocal images of NMJs from control (driver control) and Rab2-RNAi knockdown terminals immunostained for the AZ scaffold protein BRP (green) and HRP (magenta). (J) Corresponding zoom images. Scale bar, overview, 5 µm; zoom, 2 µm. (K–M) Quantifications of the representative images of I. (K) BRP sum intensity (control: 100.0 ± 5.74%, n = 7; Rab2-RNAi: 54.92 ± 4.04%, n = 7). (L) Number of AZ (control: 100.0 ± 6.0%, n = 7; Rab2-RNAi: 83.43 ± 3.772%, n = 8). (M) AZ area (control: 100.0 ± 6.436%, n = 7; Rab2-RNAi: 101.2 ± 3.556%, n = 8). (N) Number of SVs per bouton area (wild-type: 100.00 ± 7.19, n = 15; rab2−/−: 78.16 ± 7.01, n = 28). (O–S) Two electrode voltage-clamp electrophysiological recordings of NMJs from control (driver control) and Rab2-RNAi knockdown larvae. (O) Representative example eEJC traces of control and RAB2 knockdown synapses. (P) eEJC amplitudes (control: −67.18 ± 4.48 nA, n = 10; Rab2-RNAi: −42.61 ± 3.408 nA %, n = 10). (Q) eEJC charge (control: −642.7 ± 48.07 pC, n = 10; Rab2-RNAi: −393.9 ± 27.95 pC, n = 10). (R) eEJC τ (control: 5.94 ± 0.24 ms, n = 10; Rab2-RNAi: 5.65 ± 0.17 ms, n = 10). (S) 10 ms PP ratio (control: 1.01 ± 0.11, n = 10; Rab2-RNAi: 1.01 ± 0.13, n = 10). All graphs show mean ± SEM. n represents single NMJs (one or two per animal). Normality was tested with the D’Agostino and Pearson omnibus normality test. If normally distributed, the unpaired t test (E, G, H, K, L, M, N, and P–R) was used. Otherwise, the nonparametric Mann–Whitney test (F and S) was used. *, P < 0.05; ***, P < 0.001. ctrl, control; wt, wild-type.

