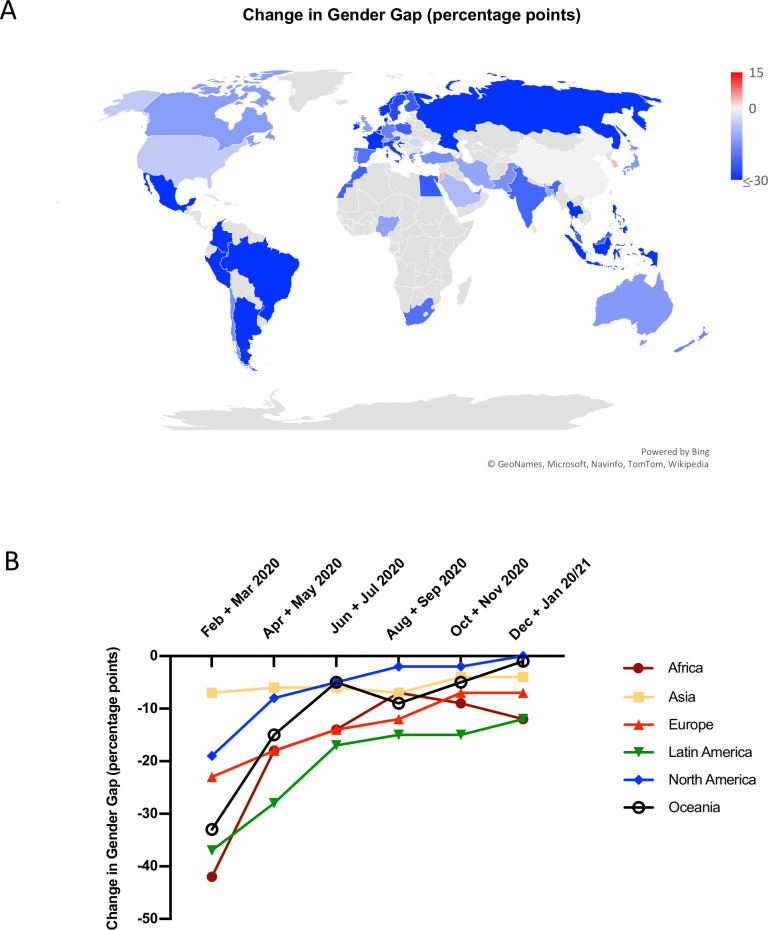
Figure 3.
Difference in first authorship gender gap, by country/geographical area. (A) World map depicting the deviation in the gender gap in first authorships for COVID-19 publications when compared with the expected gender gap derived from control publications from the same countries appearing in the same journals a year earlier. Red indicates an over-representation of women first authors, white indicates gender parity, blue indicates an over-representation of men first authors (in percentage points). (B) Time-resolved deviation in the gender gap in first authorships for COVID-19 publications when compared with the expected gender gap derived from control publications from the same geographical area appearing in the same journals a year earlier (in percentage points).

