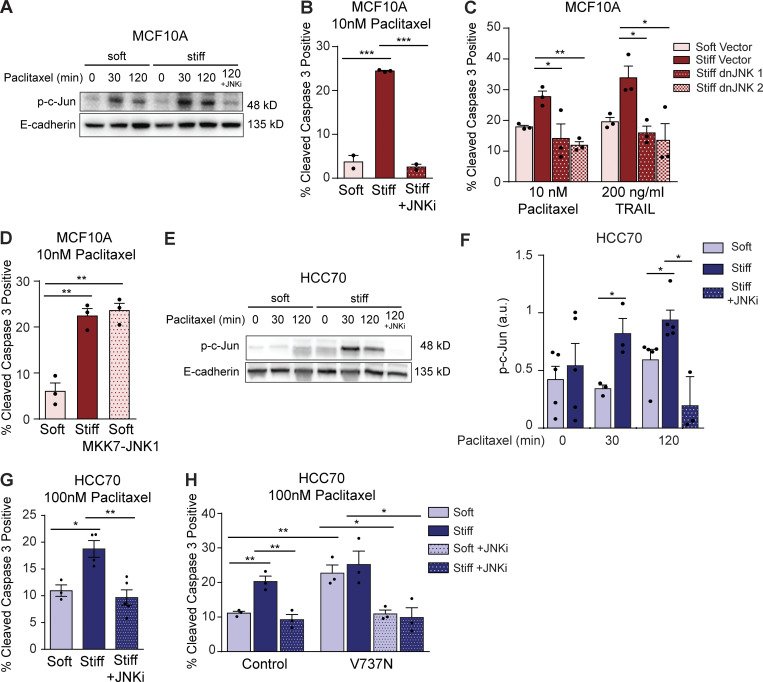
Figure 4.
Enhanced JNK activity in cells on stiff ECM sensitizes cells to chemotherapy. (A) Representative Western blot showing bands for phosphorylated c-Jun (Ser63) and E-cadherin in MCF10A cells cultured on soft or stiff substrates at indicated time points after 10 nM paclitaxel treatment or paclitaxel treatment with 5 µM JNK inhibitor SP600125. (B) Bar graph showing mean ± SEM with individual values of the percentage of cleaved caspase 3–positive cells from MCF10A cultured on soft and stiff substrates treated with 10 nM paclitaxel or 10 nM paclitaxel plus 5 µM of JNK inhibitor SP600125 (n = 2 or 3). (C) Bar graph showing mean ± SEM with individual values of the percentage of cleaved caspase 3–positive cells from MCF10A cells cultured on soft and stiff substrates and stably transduced with dominant-negative JNK1 or JNK2 constructs or the empty vector control and treated with 10 nM paclitaxel. (D) Bar graph showing mean ± SEM with individual values of the percentage of cleaved caspase 3–positive cells from MCF10A cells cultured on soft and stiff substrates and stably transduced with an inducible, constitutively active MKK7–JNK1 fusion protein and treated with 10 nM paclitaxel. (E) Representative Western blot showing bands for phosphorylated c-Jun (Ser63) and E-cadherin in HCC70 cells cultured on soft or stiff substrates at indicated time points after 100 nM paclitaxel treatment or paclitaxel treatment with 5 µM JNK inhibitor SP600125. (F) Bar graph showing mean ± SEM with individual values of p-c-Jun (Ser63) levels in HCC70 cultured on soft or stiff substrates at indicated time points after 100 nM paclitaxel treatment or paclitaxel treatment with 5 µM JNK inhibitor SP600125 quantified from Western blots by pixel density and normalized to E-cadherin (n = 3–5). (G) Bar graph showing mean ± SEM with individual values of the percentage of cleaved caspase 3–positive cells from HCC70 cultured on soft and stiff substrates treated with 100 nM paclitaxel or 100 nM paclitaxel plus 5 µM JNK inhibitor SP600125 (n = 3 or 4). (H) Bar graph showing mean ± SEM with individual values of the percentage of cleaved caspase 3–positive cells from HCC70 transduced with empty vector (control) or V737N β1 integrin mutant cultured on soft and stiff substrates treated with 100 nM paclitaxel or 100 nM paclitaxel plus 5 µM JNK inhibitor SP600125. Unless otherwise noted, n = 3 for all experiments. All statistical analyses were performed using two-tailed t test (*, P < 0.05; **, P < 0.01; ***, P < 0.001).

