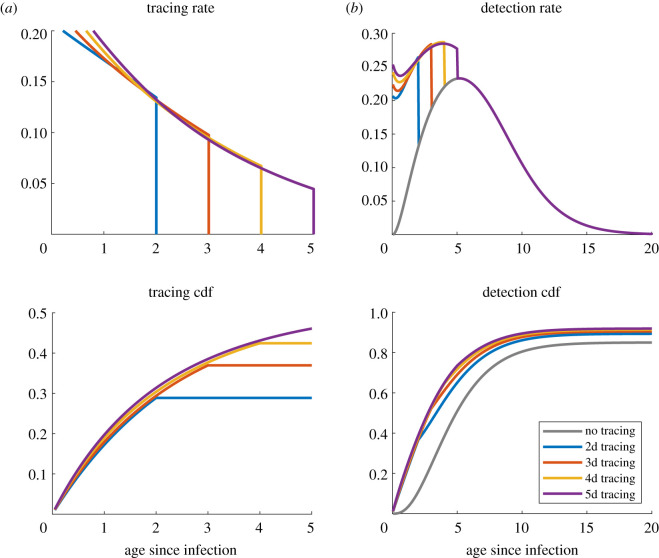
Figure 4.
(a) Computed hc and cumulative distribution function of the time to isolation for contact tracing, for different lengths of the tracing window. The cumulative distribution function is computed as from (2.3). (b) The same quantities (rate and cumulative distribution function) for the overall detection from diagnosis and contact tracing combined. The parameters are taken as in figure 3, with ɛc = 1.

