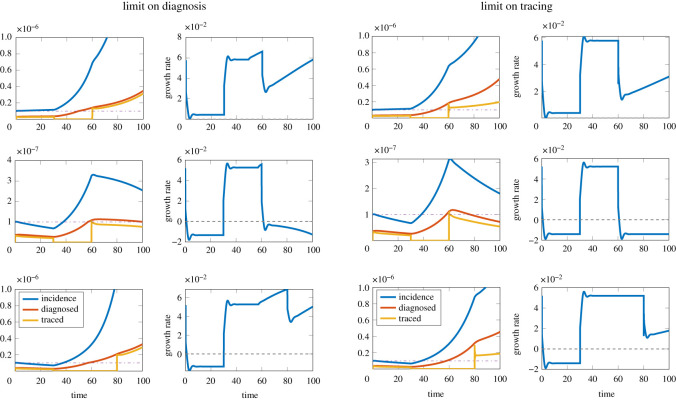
Figure 5.
Possible effects of a short-term interruption of contact tracing in the presence of maximal capacity, for R0 = 1.5 and a 2-day diagnosis delay. On the left, capacity is on tracing (max 10−7 total tracing rate); on the right, capacity is on diagnosis (max 10−7 total diagnosis rate). First row: 50% of infected individuals are diagnosed (ɛd = 0.5), the epidemic grows in the presence of contact tracing; the interruption causes a temporary increase in the real-time growth rate and the breaching of capacity (which would have occurred eventually anyway), which leads to increasing growth rate. Second row: 60% of infected individuals are diagnosed (ɛd = 0.6), the epidemic is controlled in the presence of contact tracing; interruption of contact tracing increases the value of the growth rate, but reintroducing contact tracing after T = 30 days brings the growth rate to the original level; this is delayed in the case of capacity on diagnosis (right), as the capacity is breached during the contact tracing interruption. Third row: 60% of infected individuals are diagnosed (ɛd = 0.6), the epidemic is controlled in the presence of contact tracing; the interruption of contact tracing for T = 50 days causes the breaching of capacity, so that when contact tracing is resumed it is not sufficient to control the epidemic, and an outbreak is observed. The initial condition for the infected individuals was taken as , where rd is the growth rate due to diagnosis only. Oscillations in the observed growth rate are an effect of the numerical method.

