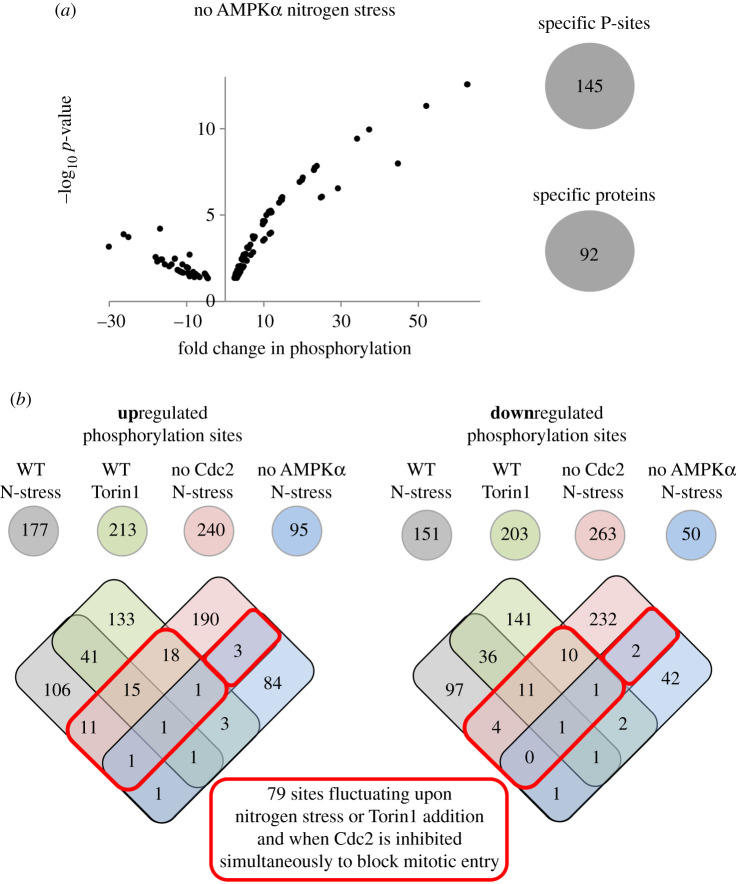
Figure 3.
Sites regulated by nitrogen stress in the absence of AMPK activation and TORC1 inhibition and overview of overlap between individual datasets. (a) Significant changes to sites of specific phosphorylation greater than or equal to 2×, p ≤ 0.05 after 30 min nitrogen stress (change of nitrogen source from glutamate to proline) compared to unstressed control of the ssp2::ura4+ (AMPK α) deletion strain is plotted as volcano plots. (Left) The number of specific phosphorylation sites and proteins identified are indicated. Specific information for all sites are listed in electronic supplementary material, data table S6. (b) The number of sites at which phosphorylation was either enhanced (upregulated) or reduced (downregulated) for each perturbation dataset. Venn diagrams were used to compare all specific phosphorylation sites identified for each perturbation. The numbers of re-identification of the same specific phosphorylation site in different datasets are shown in regions of overlap. Red boxes highlight specific phosphorylation sites that are regulated by nitrogen stress or Torin1 and also when Cdc2 is simultaneously inhibited to block mitotic entry. Specific information for these 79 sites is listed in table 2 and electronic supplementary material, data table S11.

