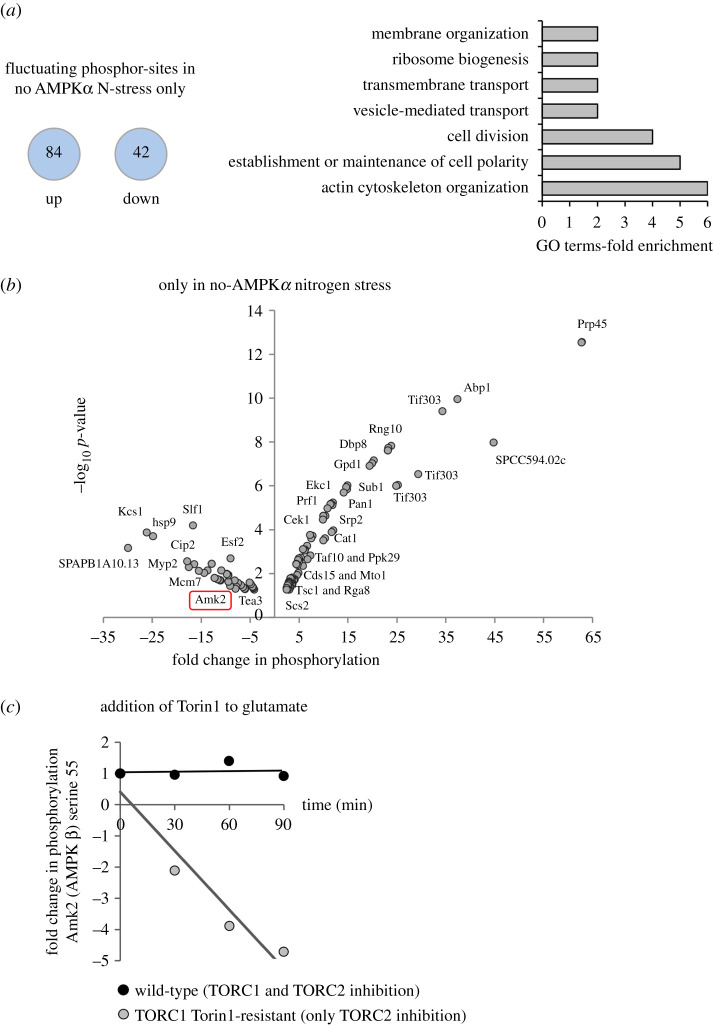
Figure 4.
Phosphorylation sites changing upon nitrogen stress are enriched on proteins regulating the actin cytoskeleton, transport and ribosome biogenesis. (a) The number of specific phosphorylation sites that are up or downregulated upon nitrogen stress of ssp2::ura4+ is shown. GO-term analysis (Princeton GOTermMapper) indicated which biological processed these proteins have been classified as participating in. (b) Specific changes to phosphorylation of specific phosphorylation sites only identified following nitrogen–stress of ssp2::ura4+ (greater than or equal to 2×, p ≤ 0.05) are plotted on a volcano plots with examples of specific proteins labelled. The red box highlights the AMPK β subunit Amk2 which is analysed further in (c). (c) Small pilot time-resolved mass spec analysis of Fold change to Amk2 serine 55 phosphorylation compared to DMSO controls, when Torin1 is added to wild-type or a TORC1-torin1-resistant mutant. Specific information for all sites are listed in electronic supplementary material, data tables S12 and S13.

