Figure 6.
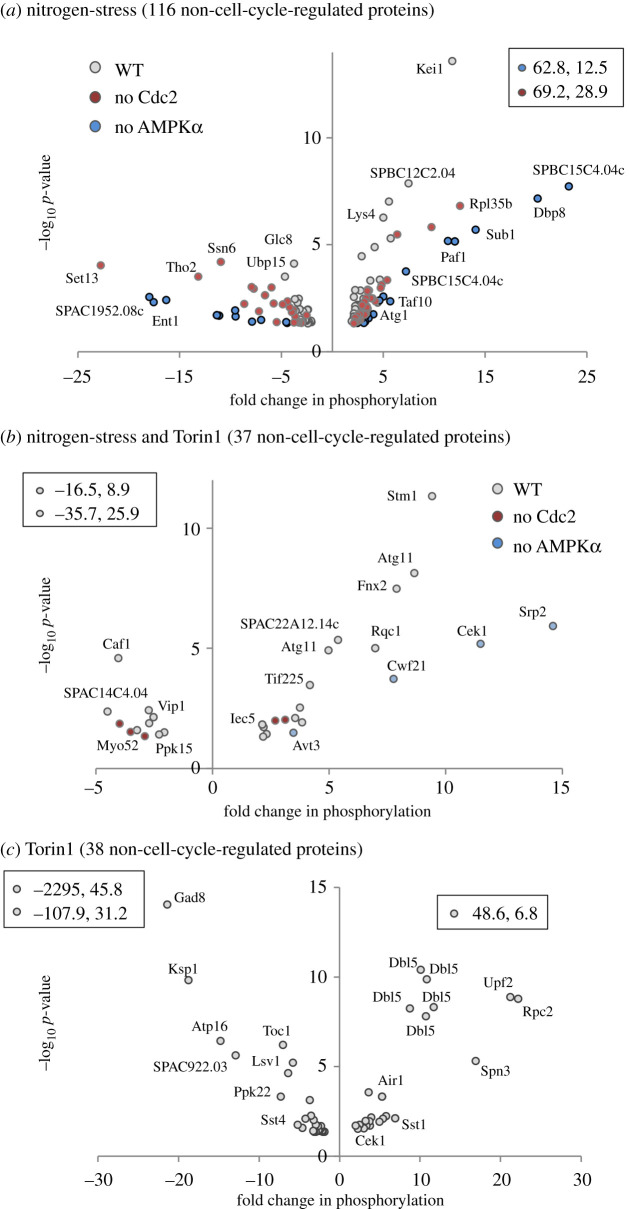
Volcano plots of specific phosphorylation sites likely to be regulated by nitrogen, TORC1 or TORC2. (a–c) Specific changes to phosphorylation of ‘non-cell-cycle’-regulated proteins, belonging to the three groups identified in figure 5b: (a) nitrogen-stress, (b) TORC1-dependent, (c) Torin1-dependent regulation; residues greater than or equal to 2×, p ≤ 0.05 are plotted as volcano plots with perturbation from which they were identified (grey, nitrogen stress of wild-type; red, nitrogen stress of cdc2.asM17; blue, nitrogen stress of ssp2::ura4+) and examples of specific proteins indicated. Data points listed within boxes falls outside plotted ranges. Specific information for all sites is listed in electronic supplementary material, data tables S14–S16.

