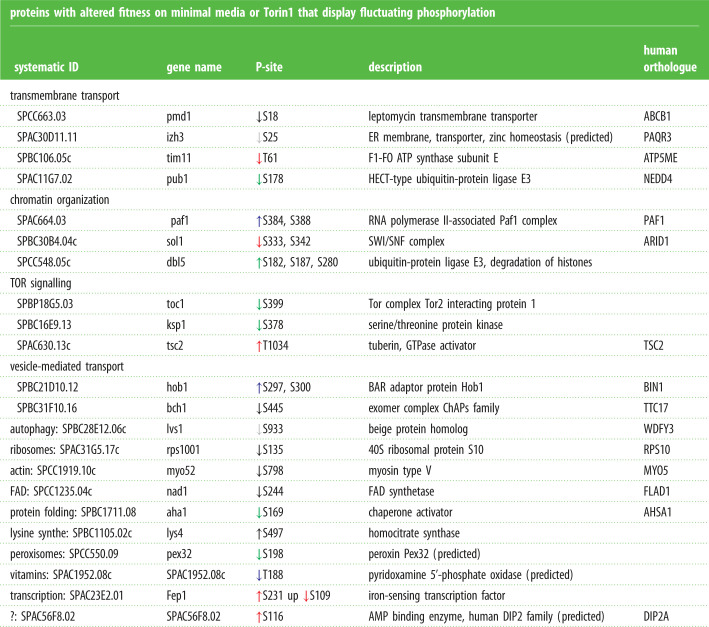
Table 2.
A wide variety of biological processes are regulated independently of mitotic commitment. List of proteins displaying fluctuating phosphorylation upon nitrogen stress or TOR inhibition and when Cdc2 is inhibited (the same phosphorylation sites highlighted by ‘red boxes’ in figure 3b). Up or downregulation of the specific phosphorylation sites, along with human orthologue and GO-term mapping for the specific proteins are indicated. The specific residue regulated a.a. = amino acid is indicated. Up, or down pointing arrows indicate enhancement or reduction in phosphorylation, respectively. The colour code indicates the specific perturbation for which the site was identified; black, nitrogen stress of wild-type; blue, nitrogen stress of ssp2::ura4+; green, Torin1 addition to wild-type. All of the listed sites fluctuate upon nitrogen stress of cdc2.asM17. Sites identified in nitrogen stress cultures of: ↓ WT ↓ AMPK or cultures added ↓ Torin1. All sites fluctuate in nitrogen stress cultures of no Cdc2.
 |
