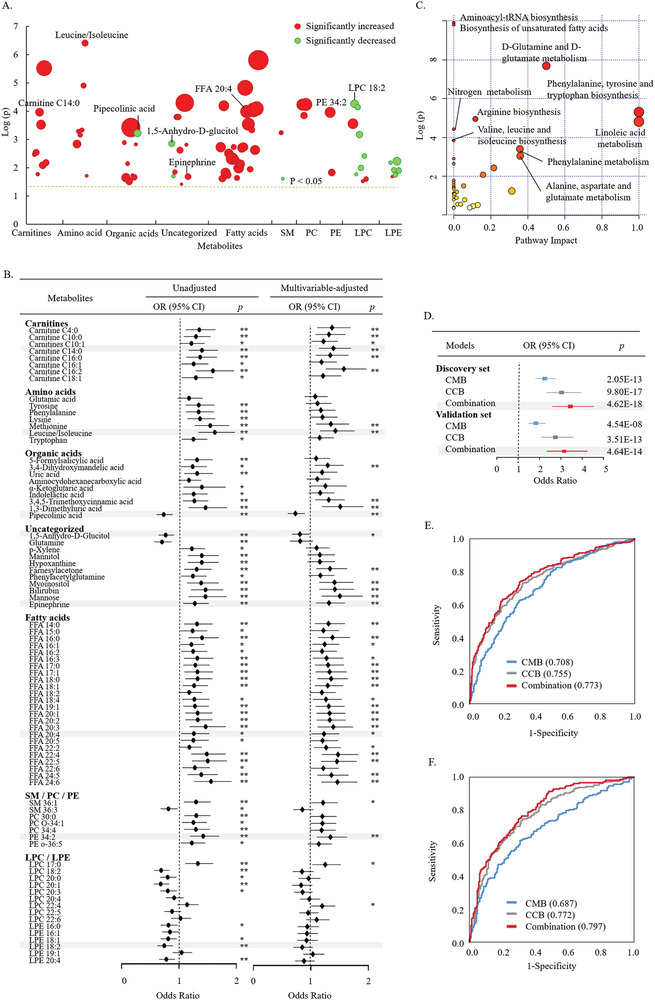
Figure 1.

A) Scatter plot of significantly changed metabolites whose p values were below 0.05 and FDR values were below 0.1 in the discovery set. The diameter of the circles indicates the degree of metabolite changes. Significantly changed metabolites with an increased level in the case group are marked in red. Significantly changed metabolites with a decreased level in the case group are marked in green. B) Significantly changed metabolites and the risk of diabetes in the discovery set. Unadjusted ORs per SD increment and multivariable‐adjusted ORs per SD increment are shown (*: p < 0.05; **: p < 0.01). The multivariable‐adjusted ORs were adjusted by age, sex, BMI, smoking status, drinking status, and physical activity. C) Pathway analysis based on significantly changed metabolites before diabetes onset. D) ORs per SD increment in predictive model scores of T2D. ROC curves of the discovery set E) and validation set F). CMB consisted of eight metabolites, and CCB consisted of BMI, TG and FG. The combination was composed of CMB and CCB.
