
Figure 2.
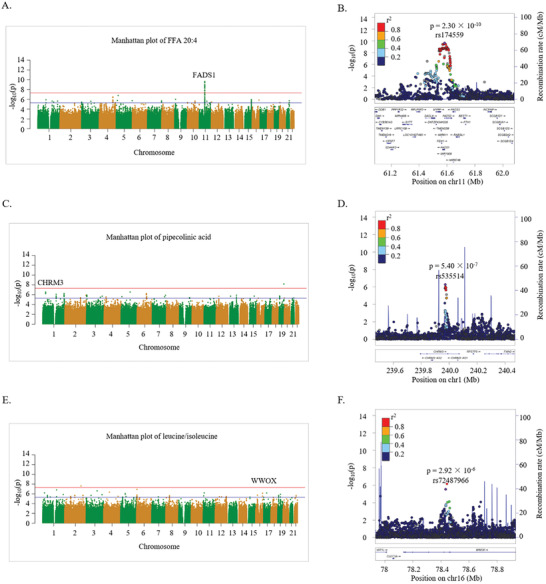
A) Manhattan plot of FFA 20:4. B) Regional plot showing LD (r 2) and p values of FFA 20:4‐related SNPs near the FADS1 gene. C) Manhattan plot of pipecolinic acid, D) Regional plot showing LD (r 2) and p values of pipecolinic acid‐related SNPs near the CHRM3 gene. E) Manhattan plot of leucine/isoleucine. F) Regional plot showing LD (r 2) and p values of leucine/isoleucine‐related SNPs near WWOX gene. The blue line and red line indicate the suggestive (p < 5.0 × 10⁻⁶) and significant (p < 5.0 × 10⁻⁸) genome‐wide thresholds, respectively.