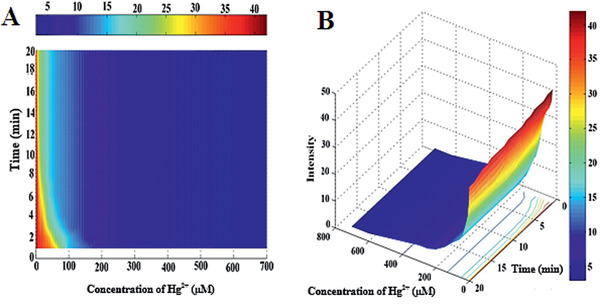
Figure 3.

Dependence of reaction time of Aw‐AgNPs with Hg2+ on response curve (intensity vs time and concentration of Hg2+). Here, the time range was 1 to 20 min, and the concentration range of Hg2+ ions was 1 × 10⁻⁶ –700 × 10−6 m; A) 2D and B) 3D plot.
