Figure 7.

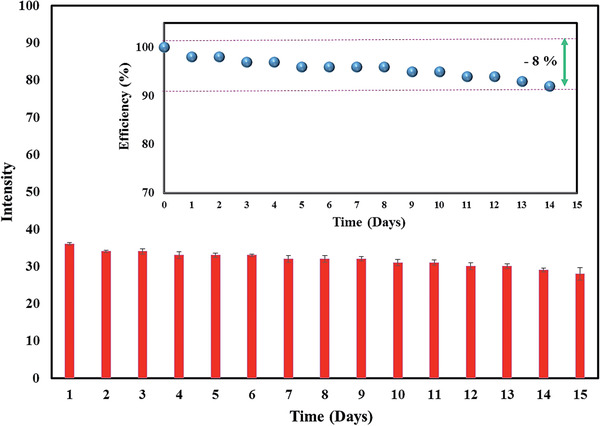
Data plot on intraday investigation viewing the change of intensity on designed paper test using Hg2+ solution (1 × 10⁻⁶ m). The changes in the signal readout of the colorimetric paper‐based are represented as percent efficiency (inset).

Data plot on intraday investigation viewing the change of intensity on designed paper test using Hg2+ solution (1 × 10⁻⁶ m). The changes in the signal readout of the colorimetric paper‐based are represented as percent efficiency (inset).