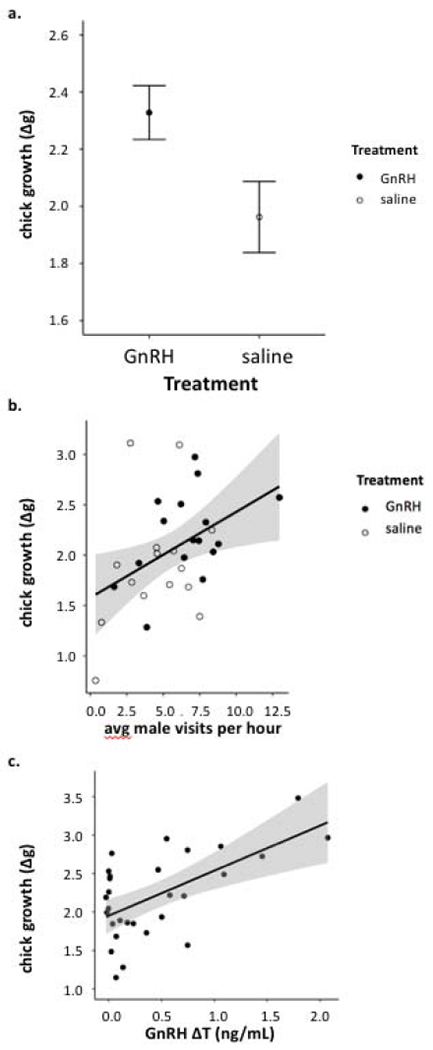
Figure 3:

At the age of their peak growth, (a) chicks of GnRH males gained more mass in the day following treatment; (b) average growth per nest was positively correlated with the rate of paternal visits; and (c) within the GnRH treatment, the degree of T elevation was correlated with average chick growth in the day following paternal treatment. Error bars are ± SE and shaded areas are 95% confidence intervals. These conditional plots are generated using the package visreg (Breheny and Burchett, 2017), which represents the relationship between one predictor and response variable by holding other predictors constant (see Table 3).
