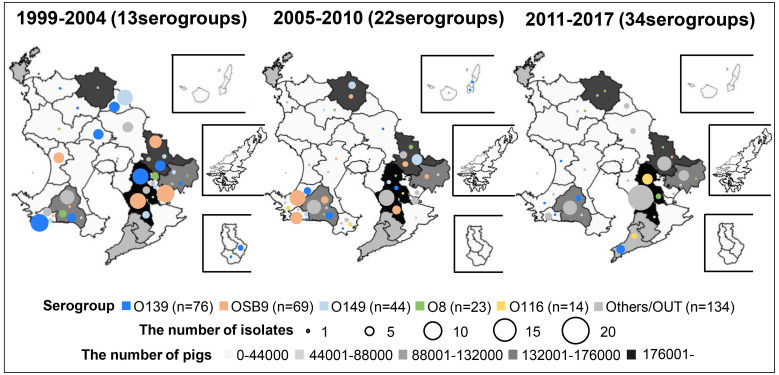
Fig. 2.
Temporal changes in O serogroups in Escherichia coli isolated from diseased swine in each area of Kagoshima Prefecture, Japan. The prevalence of O serogroups between 1999 and 2004, 2005 and 2010, and 2011 and 2017 was compared, and the number of O serogroups detected in each period is shown in parentheses. The size of the circle in each area represents the number of isolates. The O serogroups O139, OSB9, O149, O8, and O116 are indicated in blue, pink, light blue, green, and yellow, respectively, and the other O serogroups (other than O139, OSB9, O149, O8, and O116) and OUT isolates are indicated in gray. The number of healthy swine in each area is represented on the map with color gradation from light gray to black.

