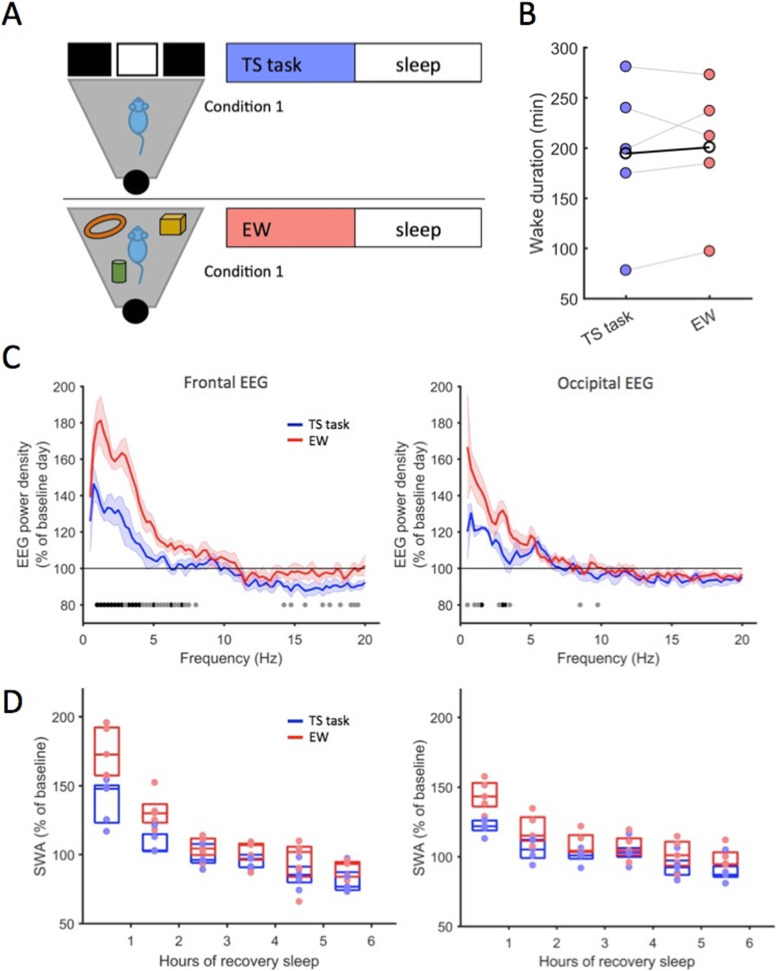
Fig. 3.
Effect of operant behaviour on sleep and NREM EEG spectra. a Outline of the experiment. In condition 1, mice perform the TS task for ad libitum duration from the light onset. In condition 2 (EW), mice are kept awake with novel objects for the corresponding duration to the TS performance. b Total wake durations from before the respective experimental manipulation (TS or EW) until sleep onset afterwards. Points depict individual animal averages, black line depicts the mean across animals (p = 0.6, n.s., Wilcoxon signed rank test). c Average NREM EEG spectra of the first hour of recovery sleep after TS and EW conditions. Shaded areas depict standard errors of the mean. Horizontal lines denote frequency bins where EEG power was different between TS and EW conditions (black: p < 0.05, grey: p < 0.1, Wilcoxon rank sum tests). d EEG slow-wave activity (0.5–4 Hz EEG band) during recovery NREM sleep after TS and EW. Dots represent the average SWA of individual animals shown in hourly bins, depicted as percentage of average SWA of preceding baseline day (frontal EEG: repeated measures ANOVA (factors hour, condition) on log-transformed data revealed statistically significant effect of hour (F (7, 28)=32.6, p < 0.0001), and a significant interaction between condition and hour (F (7, 28)=4.7, p < 0.01)). Tukey post hoc tests revealed a significant difference between TS and EW for hours 1 and 2 (hours 1–6: p = 0.0009, 0.003, 0.45 0.29, 0.42, 0.22). Occipital EEG: significant effect of hour (F (7, 28)=19.08, p < 0.0001), significant interaction between hour and condition (F (7, 28)=4.75, p < 0.01) and a significant effect of condition (F (1, 4)=15.09, p < 0.05). Tukey post hoc testing revealed significant differences between TS and EW as follows: hours 1–6: p = 0.0005, 0.002, 0.1, 0.07, 0.09, 0.009

