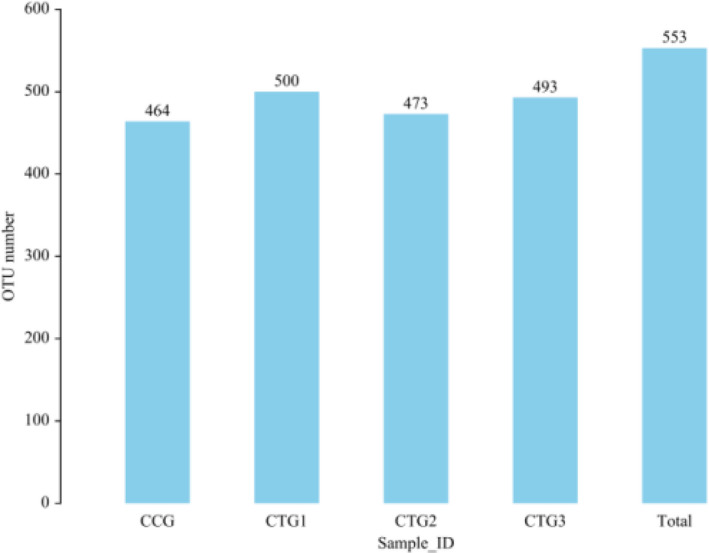
FIGURE 1.

Distribution of OTU number of each group. Note: UCLUST is used in software QIIME (version 1.8.0) to cluster tags at 97% similarity level and obtain OTU. CCG, CTG1, CTG2 and CTG represent control group, treatment group 1, treatment group 2 and treatment group 3, respectively
