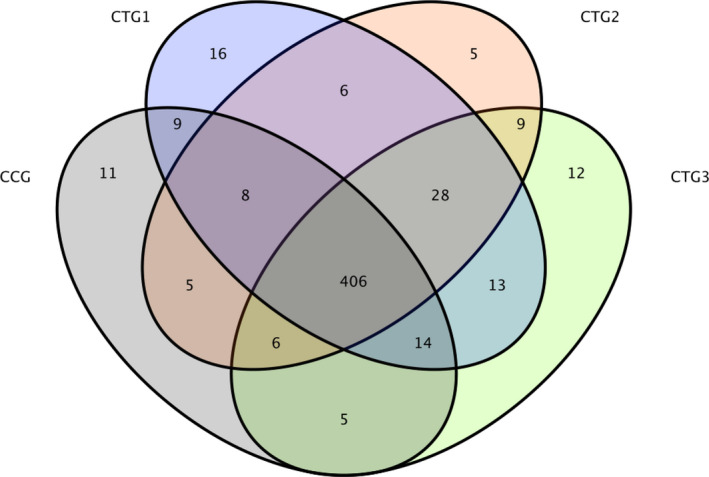
FIGURE 2.

Venn map. Note: A Venn diagram represents the number of common and unique OTUs and the coincidence of OTUs between the samples. CCG, CTG1, CTG2 and CTG represent control group, treatment group 1, treatment group 2 and treatment group 3, respectively
