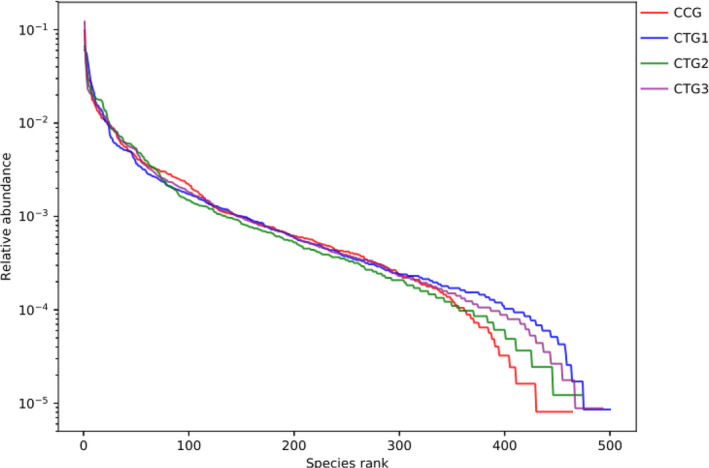
FIGURE 3.

Rank abundance curve. Note: Rank abundance curve is a curve chart that sorts the OTU abundance of each sample by size and draws based on its relative abundance. It is mainly used to explain the species richness and evenness of the samples at the same time. The species richness is reflected by the length of the curve on the horizontal axis. The wider the curve, the richer the species composition. The evenness of species composition is reflected by the curve. The flat curve represents homogeneous species composition. CCG, CTG1, CTG2 and CTG represent control group, treatment group 1, treatment group 2 and treatment group 3, respectively
