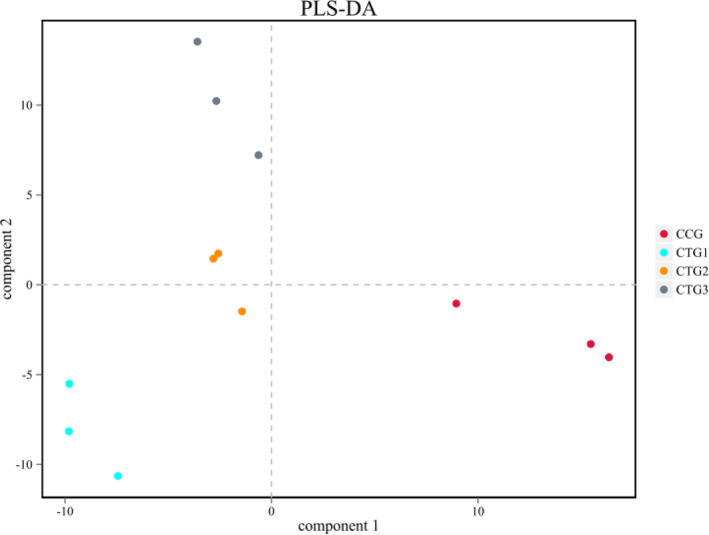
FIGURE 4.

Partial least squares discrimination (PLS‐DA) analysis. Note: QIIME software is used for beta diversity analysis to compare the similarity of different samples in terms of species diversity. In the results, different colors represent different groups, the closer the samples are, the more similar the microbial composition and structure between the samples have. CCG, CTG1, CTG2 and CTG represent control group, treatment group 1, treatment group 2 and treatment group 3, respectively
